 FAO Map Catalog
Type of resources
Available actions
Topics
Keywords
Contact for the resource
Provided by
Years
Formats
Representation types
Update frequencies
status
Scale
Resolution
-
**Table content** - Year - Indicator - Commodity - Value - Flag - Unit **Value assigned to No-data**:m
-
The main sources of information for the species distribution are the habitat description and geographic range contained in the published FAO Catalogues of Species (more details at http://www.fao.org/fishery/fishfinder ). Terms used in the descriptive context of the FAO Catalogues were converted in standard depth, geographic and ecological regions and inserted into a Geographic Information System.
-
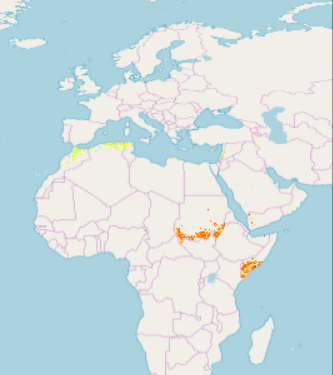
Part of the Integrated Vulnerability Assessment in the Arab Region, this 1km pixel resolution raster dataset provides a representation of future change in vulnerability hotspots for People sector, in the Middle East and North Africa Region. The raster grid was generated for Mid-Century time period (2046-2065), and for moderate emission scenario - representative concentration pathway (RCP4.5) - developed by the Intergovernmental Panel on Climate Change (IPCC). Pixel values were classified according to vulnerability level: class 10 the top 10%, class 20 top 20% and class 30 top 30%. Vulnerability is a concept used to express the complex interaction of climate change effects and the susceptibility of a system to its impacts. The integrated vulnerability assessment methodology is based on an understanding of vulnerability as a function of a system’s climate change exposure, sensitivity and adaptive capacity to cope with climate change effects, consistent with the approach put forward by the IPCC in its Fourth Assessment Report (AR4). It adopts the time periods generally used by the IPCC and other regional climate modelling experiments and runs climate simulations based on future time periods that are compared with a historical reference period.
-
The map represents the water deficit per pixel computed as 1 minus the ratio of ETa over ETx (max crop ET) over the Samba main growing season (August to December) 2017, for the irrigated command areas identified by the ADB project in Tamil Nadu state of India. The RWD50 image indicates pixels showing up to 50% water deficit. The pixel value in the RWD50 indicates the percentage of time (no. of deficit days/total days in a season) a given pixel experienced up to 50% of the water deficit.
-

A survey of rubber growing areas of Thailand (7 Sheets)
-
The main sources of information for the species distribution are the habitat description and geographic range contained in the published FAO Catalogues of Species (more details at http://www.fao.org/fishery/fishfinder ). Terms used in the descriptive context of the FAO Catalogues were converted in standard depth, geographic and ecological regions and inserted into a Geographic Information System.
-
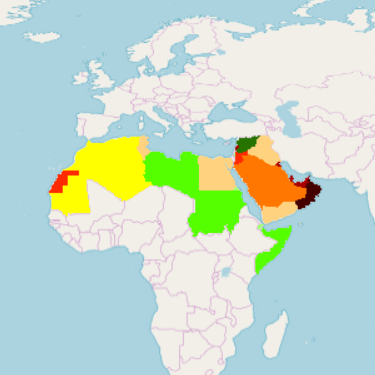
Part of the Integrated Vulnerability Assessment in the Arab Region, this 1km pixel resolution raster dataset provides a representation of sensitivity to climate change impact for the population dimension indicator – Water Consumption per Capita - in the Middle East and North Africa Region. Vulnerability is a concept used to express the complex interaction of climate change effects and the susceptibility of a system to its impacts. The integrated vulnerability assessment methodology is based on an understanding of vulnerability as a function of a system’s climate change exposure, sensitivity and adaptive capacity to cope with climate change effects, consistent with the approach put forward by the Intergovernmental Panel on Climate Change (IPCC) in its Fourth Assessment Report (AR4). Within this conceptual framework, Sensitivity provides information about the status quo of the physical and natural environment that makes the affected systems particularly susceptible to climate change. Sensitivity indicators were clustered into three dimensions: population, natural, and manmade. Within the vulnerability assessment methodology it is assumed the indicators retain the same values for reference period and future periods. A class value of 1 was assigned to represent a favorable condition (low sensitivity) while a class value of 10 designates an unfavorable condition.
-
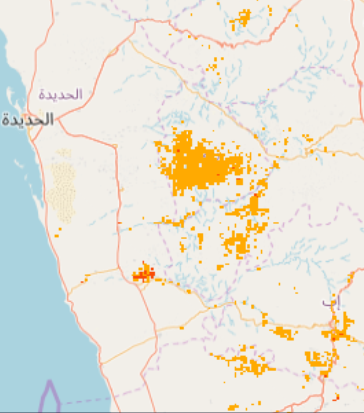
Part of the Integrated Vulnerability Assessment in the Arab Region, this 1km pixel resolution raster dataset provides a representation of future change in vulnerability for People:Employment Rate for the Agricultural Sector sub-sector, in the Middle East and North Africa Region. The Raster grid was generated for moderate representative concentration pathway (RCP4.5) emission scenario developed by the Intergovernmental Panel on Climate Change (IPCC) for time period Mid-Century (2046-2065). Pixel values are classified according to level of vulnerability, from low 1 to high 10. Vulnerability is a concept used to express the complex interaction of climate change effects and the susceptibility of a system to its impacts. The integrated vulnerability assessment methodology is based on an understanding of vulnerability as a function of a system’s climate change exposure, sensitivity and adaptive capacity to cope with climate change effects, consistent with the approach put forward by the IPCC in its Fourth Assessment Report (AR4). It adopts the time periods generally used by the IPCC and other regional climate modelling experiments and runs climate simulations based on future time periods that are compared with a historical reference period.
-
The main sources of information for the species distribution are the habitat description and geographic range contained in the published FAO Catalogues of Species (more details at http://www.fao.org/fishery/fishfinder ). Terms used in the descriptive context of the FAO Catalogues were converted in standard depth, geographic and ecological regions and inserted into a Geographic Information System.
-
The FAO major fishing areas for statistical purpose are defined by the CWP handbook of fishery statistical standards available at http://www.fao.org/fishery/cwp/handbook/h/en