 FAO Map Catalog
World
Type of resources
Available actions
Topics
Keywords
Contact for the resource
Provided by
Years
Formats
Representation types
Update frequencies
status
Scale
Resolution
-

The Climate Change ATLAS (CSIC, https://github.com/SantanderMetGroup/ATLAS) provides climate change information for essential climate variables generated from CMIP and CORDEX international initiatives. There are different data cubes for experiment and variable providing climate projections for 1) three reference future periods (2021-2040, 2041-2060, 2080-2100) for RCP 2.6 an 8.5 scenarios with respect to the baseline reference period 1981-2010, and 2) three Global Warming Levels (1.5, 2 and 3 degC, obtained from the RCP8.5 scenario), with respect to preindustrial values (as characterized by the 1850-1900 period). The list of experiments and models used is available at https://github.com/SantanderMetGroup/ATLAS/tree/master/AtlasHub-inventory
-
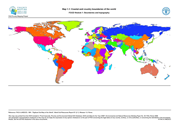
The FGGD coastal and country boundaries of the world is a global datalayer that is available in both vector and raster formats, with a vector scale of 1:5 000 000 and a raster resolution of 5 arc-minutes. It contains coastal and country boundaries from Digital Soil Map of the World, updated to 2005 according to internationally-recognised changes reported by the UN Geographic Information Working Group (DPKO/UNCS).
-

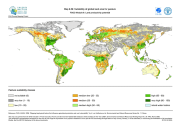
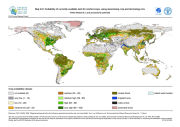
The FGGD pasture suitability map on currently available land is a global raster datalayer with a resolution of 5 arc-minutes. Pixels classified as urban, closed forest or irrigated contain negative values. Each remaining pixel contains the suitability index for pasture, 2005 version. The method is described in FAO and IIASA, 2007, Mapping biophysical factors that influence agricultural production and rural vulnerability, by H. von Velthuizen et al.
-
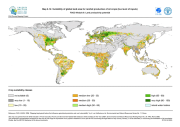
The FGGD pasture suitability map is a global raster datalayer with a resolution of 5 arc-minutes. Each pixel contains the suitability index for pasture, 2005 version. The method is described in FAO and IIASA, 2007, Mapping biophysical factors that influence agricultural production and rural vulnerability, by H. von Velthuizen et al.
-
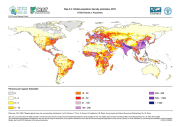
The FGGD estimated 2015 global population density map is a global raster datalayer with a resolution of 2.5 arc-minutes. Each pixel contains an estimated value for persons per square kilometre in 2015, obtained by applying population growth trends to population counts for the lowest subnational administrative unit for which 2000 population data were available. The method used by FAO and CIESIN to generate this datalayer is described in FAO, 2005, Mapping global urban and rural population distributions, by M. Salvatore, et. al.
-

The FGGD multiple cropping zone map under rainfed conditions on currently available land is a global raster datalayer with a resolution of 5 arc-minutes. Pixels classified as urban, closed forest or irrigated contain negative values. Each remaining pixel contains contains the 2005 version of the suitability index for multiple cropping on the land area of the pixel. The method is described in FAO and IIASA, 2007, Mapping biophysical factors that influence agricultural production and rural vulnerability, by H. von Velthuizen et al.
-
Grid with estimated easily available soil moisture in mm/m with a spatial resolution of 5 * 5 arc minutes. Information with regard to easily available soil moisture was calculated from the "Derived Soil Properties" of the "Digital Soil Map of the World" which contains raster information on soil moisture in different classes.
-
The FGGD suitability map using maximising crop and technology mix is a global raster datalayer with a resolution of 5 arc-minutes. Pixels classified as urban, closed forest or irrigated contain negative values. Each remaining pixel contains the suitability index for rainfed crops, using maximising crop and technology mix, 2005 version. The method is described in FAO and IIASA, 2007, Mapping biophysical factors that influence agricultural production and rural vulnerability, by H. von Velthuizen et al.
-
Content on the Climate Risk Analysis concept and purpose is needed
-
The FGGD crop suitability maps at low, intermediate and high levels of inputs under rainfed conditions on global land area are global raster datalayers with a resolution of 5 arc-minutes. Each pixel contains the 2005 version of the suitability index for rainfed production of the crop or crop group concerned. The method and crop coverage of each crop group are described in FAO and IIASA, 2007, Mapping biophysical factors that influence agricultural production and rural vulnerability, by H. von Velthuizen et al.