 FAO Map Catalog
3000000
Type of resources
Available actions
Topics
Keywords
Contact for the resource
Provided by
Years
Formats
Representation types
Update frequencies
status
Scale
-

Organic soils and peatlands in particular have high influence on climate change and on the global carbon cycle. Indeed, the cultivation of organic soils entails drainage which causes significant release of CO2 in the atmosphere. Detailed information on regional and global emission trends of these soils is however scarce, due to the difficulty to map, measure and assess the complex dynamics of land, soil and water interactions that are required for a correct understanding of the degradation of organic soils caused by human activity. A geospatial analysis of drained organic soils and associated greenhouse gas emissions (GHG) were undertaken as part of the FAOSTAT global database of emissions for the Agriculture, Forestry and Other Land Use AFOLU sector. The database was first published in FAOSTAT in 2012 and it is updated yearly (FAO, 2016). Emissions estimates are derived from emission factors as reported in the 2006 IPCC guidelines and from activity data, namely the spatial distribution of organic soils and the spatial distribution of cropland on organic soils. This metadata accompanies the public distribution of the layers applied for this spatial analysis. The geographical distribution of organic soils was derived from the Harmonized World Soil Database (HWSD v 1.2)(Nachtergaele et al., 2012). The HWSD v 1.2 dataset was queried to extract all pixels with any share of histosols, either as dominant or secondary soil type and to derive a map of the area of organic soils. The total area covered by the histosols worldwide resulted to be approximately 330 million hectares, a figure consistent with previous estimates. The land cover layer GLC2000 (Barthomé and Belward, 2005) was the source for cropland distribution. More information can be found in: a) Tubiello F.N., Biancalani R., Salvatore M., Rossi S., Conchedda, G., 2016. A Worldwide Assessment of Greenhouse Gas Emissions from Drained Organic Soils. Sustainability 8(4), 371; http://dx.doi.org/10.3390/su8040371. b) Contribution of drained organic soils to GHG emissions in Towards climate-responsible peatlands management (Biancalani R., Salvatore M. and F.N. Tubiello), FAO, Rome, 2014. Page 12-14. References: 1) Nachtergaele, F. O.; van Velthuizen, H.; Verelst, L.; Wiberg, D. Harmonized World Soil Database v 1.2; FAO/IIASA/ISRIC/ISS - CAS/JRC: FAO, Rome, Italy and IIASA, Laxenburg, Austria, 2012. 2) Bartholomé, E.; Belward, A. S. GLC2000: a new approach to global land cover mapping from Earth observation data. Int. J. Remote Sens. 2005, 26 (9), 1959–1977. 3) FAO, 2016. FAOSTAT Emissions database. Acknowledgements: These spatial layers were produced as part of a large interdisciplinary activity across technical divisions of FAO, under the leadership of the Climate and Environment Division and the Statistics Division, within the project “Monitoring and Assessment of GHG Emissions in Agricultureâ€. Generous funding was provided by the Governments of Germany and Norway, GCP/GLO/286/GER and GCP/GLO/325/NOR.
-
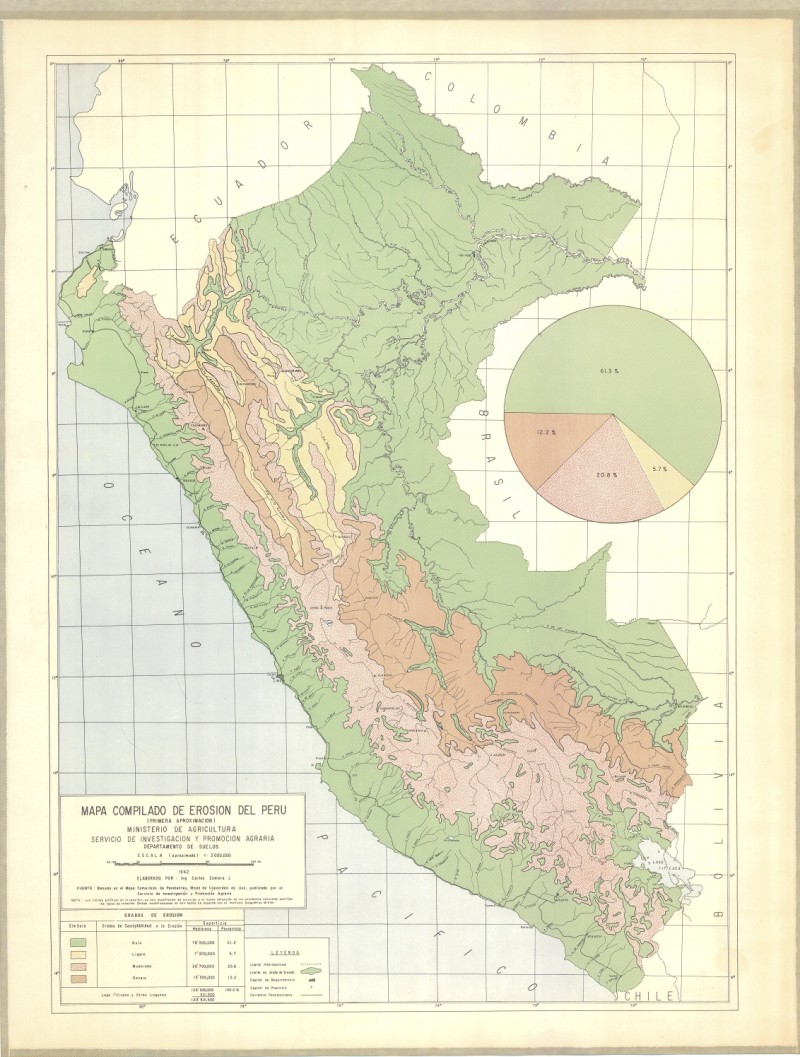
Mapa compilado de erosion del Peru
-

Ad1-Linear coastlines, national and other areas of sovereignty boundaries compiled from multiple RWDB2 source layers, circa 1997. The RWDB_AD1-LN shapefile data layer is comprised of 18870 derivative vector framework library features derived based on 1:3 000 000 data originally from RWDBII. The layer provides nominal analytical/mapping at 1:3 000 000. Data processing complete globally. Acronyms and Abbreviations: RWDB2 or RWDB II- Relational World Database II.
-

Livestock is one of the fastest-growing sectors in agriculture, potentially presenting opportunities for economic growth and poverty reduction in rural areas. Dealing with the important social, environmental and public health issues linked to sector growth will require solutions that embrace the way in which the livestock sector grows to meet the increasing demand for animal-source foods. It is then important to understand where growth in demand for livestock commodities is likely to occur, and how and where production of livestock commodities will be increased in order to meet it. Estimates of supply and demand for animal-source foods, provided by the Global Perspective Studies Unit at FAO, have been disaggregated spatially for the years 2000 and 2030. Demand for animal-source foods (beef, milk, mutton, pork, poultry meat and eggs) was mapped by estimating per-capita consumption and applying this to mapped population distributions in 2000. Population maps were produced for 2030 based on projected population growth and urbanisation rates and future estimates of per-capita demand applied to these. Similarly, livestock production maps were produced by spatially disaggregating the estimated production based on maps of the relevant livestock species. Methods and results are presented in the forthcoming FAO working paper âMapping Supply and Demand for Animal-Source Foods to 2030 (by T.P. Robinson and F. Pozzi, 2011). Grids and tabular data are distributed here by livestock product and by continent.
-
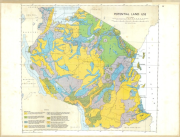
Potential land use
-
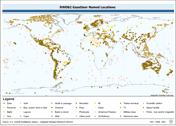
Point based gazetteer of named locations. The RWDB_GZTR shapefile data layer is comprised of 3031 derivative vector framework library features derived based on 1:3 000 000 data originally from RWDBII. The layer provides nominal analytical/mapping at 1:3 000 000. Data processing complete globally. Acronyms and Abbreviations: RWDB2 or RWDB II- Relational World Database II.
-
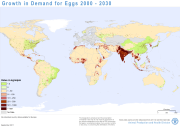
Livestock is one of the fastest-growing sectors in agriculture, potentially presenting opportunities for economic growth and poverty reduction in rural areas. Dealing with the important social, environmental and public health issues linked to sector growth will require solutions that embrace the way in which the livestock sector grows to meet the increasing demand for animal-source foods. It is then important to understand where growth in demand for livestock commodities is likely to occur, and how and where production of livestock commodities will be increased in order to meet it. Estimates of supply and demand for animal-source foods, provided by the Global Perspective Studies Unit at FAO, have been disaggregated spatially for the years 2000 and 2030. Demand for animal-source foods (beef, milk, mutton, pork, poultry meat and eggs) was mapped by estimating per-capita consumption and applying this to mapped population distributions in 2000. Population maps were produced for 2030 based on projected population growth and urbanisation rates and future estimates of per-capita demand applied to these. Similarly, livestock production maps were produced by spatially disaggregating the estimated production based on maps of the relevant livestock species. Methods and results are presented in the forthcoming FAO working paper âMapping Supply and Demand for Animal-Source Foods to 2030 (by T.P. Robinson and F. Pozzi, 2011). Grids and tabular data are distributed here by livestock product and by continent.
-
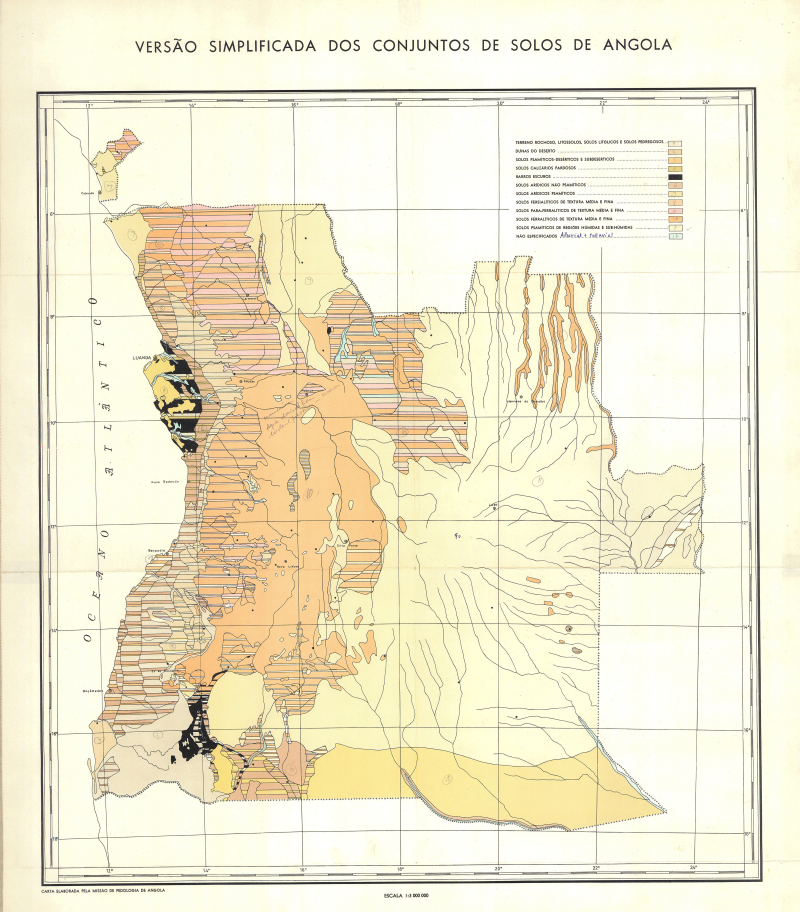
Simplified soil map of Angola
-

Mapa de capacidad de uso del Peru (Primera aproximacion)-
-
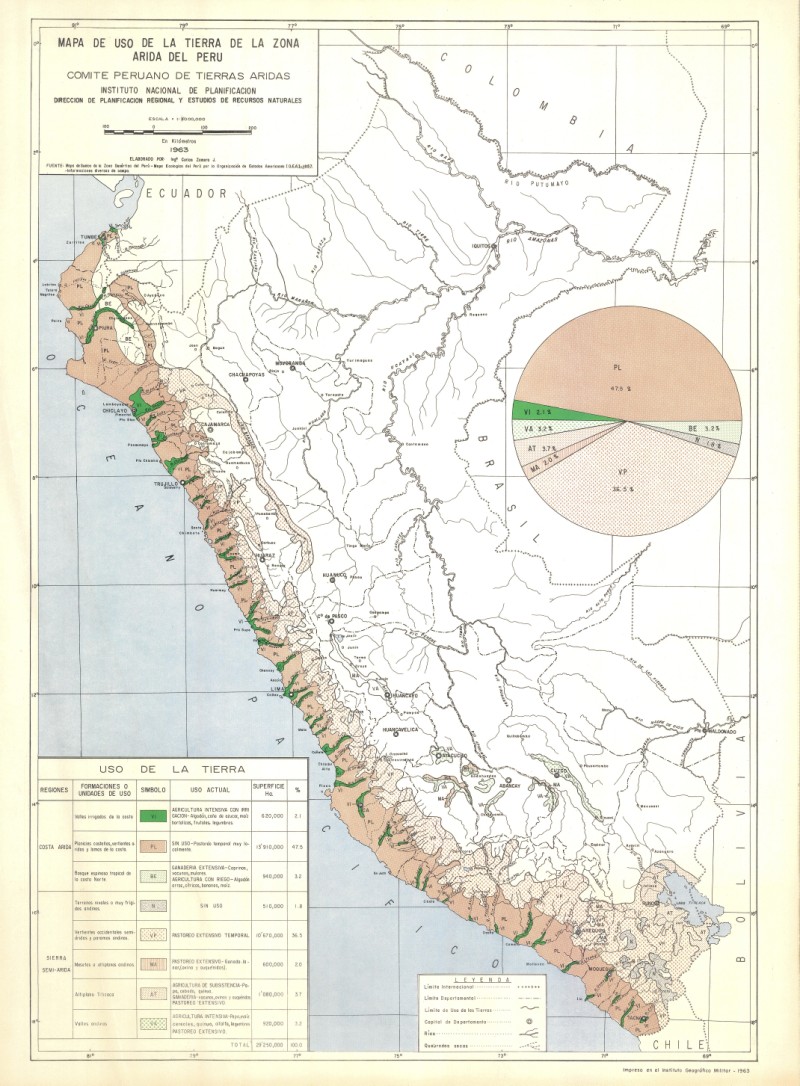
Mapa de uso de la tierra