 FAO Map Catalog
asNeeded
Type of resources
Available actions
Topics
Keywords
Contact for the resource
Provided by
Years
Formats
Representation types
Update frequencies
status
Scale
Resolution
-
The main sources of information for the species distribution are the habitat description and geographic range contained in the published FAO Catalogues of Species (more details at http://www.fao.org/fishery/fishfinder ). Terms used in the descriptive context of the FAO Catalogues were converted in standard depth, geographic and ecological regions and inserted into a Geographic Information System.
-
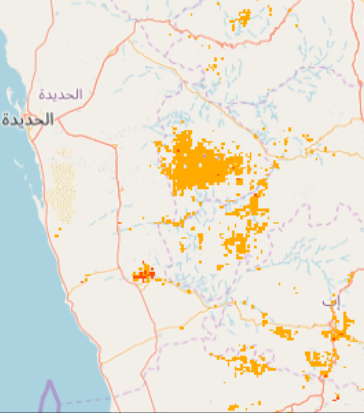
Part of the Integrated Vulnerability Assessment in the Arab Region, this 1km pixel resolution raster dataset provides a representation of future change in vulnerability hotspots for Agriculture:Water Available for Crops sub-sector, in the Middle East and North Africa Region. The raster grid was generated for high emission scenario, representative concentration pathway (RCP8.5), developed by the Intergovernmental Panel on Climate Change (IPCC) and for End-Century (2081-2100) time period . Pixel values are classified according to vulnerability level: class 10 the top 10%, class 20 top 20% and class 30 top 30%. Vulnerability is a concept used to express the complex interaction of climate change effects and the susceptibility of a system to its impacts. The integrated vulnerability assessment methodology is based on an understanding of vulnerability as a function of a system’s climate change exposure, sensitivity and adaptive capacity to cope with climate change effects, consistent with the approach put forward by the IPCC in its Fourth Assessment Report (AR4). It adopts the time periods generally used by the IPCC and other regional climate modelling experiments and runs climate simulations based on future time periods that are compared with a historical reference period.
-
These datasets are the main products of the National Land Use Land Cover (LULC) mapping for each epoch done by National Forestry Authority. They represent Uganda's LULC classified into 13 main classes and sub-classes according to the National Biomass Study (NBS) classification system. The NBS classification system was designed to be robust with capacity to store data on Land cover, Biomass and Wetness. Datasets available are 1990, 2000, 2005, 2010, 2015 and 2017.
-
The FAO major fishing areas for statistical purpose are defined by the CWP handbook of fishery statistical standards available at http://www.fao.org/fishery/cwp/handbook/h/en
-

Part of the Integrated Vulnerability Assessment in the Arab Region, this 1km pixel resolution raster dataset provides a representation of Adaptive Capacity to climate change, for Infrastructure dimension indicator - Water and Sanitation - Access to Improved Sanitation - in the Middle East and North Africa Region. Vulnerability is a concept used to express the complex interaction of climate change effects and the susceptibility of a system to its impacts. The integrated vulnerability assessment methodology is based on an understanding of vulnerability as a function of a system’s climate change exposure, sensitivity and adaptive capacity to cope with climate change effects, consistent with the approach put forward by the Intergovernmental Panel on Climate Change (IPCC) in its Fourth Assessment Report (AR4). Combining exposure, sensitivity and adaptive capacity allows assessing the vulnerability of a system to climate change. Within this conceptual framework, Adaptive Capacity refers to “the ability of a system to adjust to climate change (including climate variability and extremes), to moderate potential damages, to take advantage of opportunities, or to cope with the consequences” as defined in the IPCC AR4. The Adaptive Capacity Infrastructure dimension can be considered as ability mechanisms whereby they characterize the accessibility to the built environment as a means to adapt. Indicators were selected based on five pillars: energy, transportation, health, water and sanitation, and environment, were assumed to retain the same values for the reference period and future periods, and raster grid pixel values classified according to level of Adaptive Capacity, from low 1 to high 10.
-

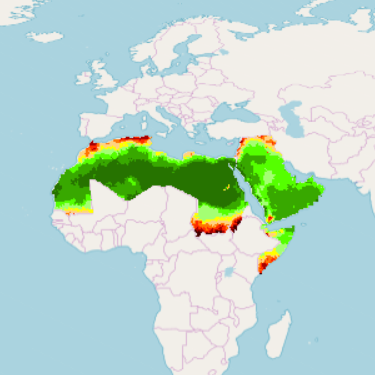
Part of the Integrated Vulnerability Assessment in the Arab Region, this 1km pixel resolution raster dataset provides a representation of Sensitivity to climate change impact for the Natural dimension indicator – Degradation of Vegetation Cover - in the Middle East and North Africa Region. Vulnerability is a concept used to express the complex interaction of climate change effects and the susceptibility of a system to its impacts. The integrated vulnerability assessment methodology is based on an understanding of vulnerability as a function of a system’s climate change exposure, sensitivity and adaptive capacity to cope with climate change effects, consistent with the approach put forward by the Intergovernmental Panel on Climate Change (IPCC) in its Fourth Assessment Report (AR4). Within this conceptual framework, Sensitivity provides information about the status quo of the physical and natural environment that makes the affected systems particularly susceptible to climate change. Sensitivity indicators were clustered into three dimensions: population, natural, and manmade. Within the vulnerability assessment methodology it is assumed the indicators retain the same values for reference period and future periods. A class value of 1 was assigned to represent a favorable condition (low sensitivity) while a class value of 10 designates an unfavorable condition.
-
This raster dataset provides a representation of the extreme temperature index SU40, Annual Very Hot Days - Annual number of days when daily maximum temperature > 40ºC - for the Middle East and North Africa Region. The Regional Climate Model (RCM) ensemble adopts the time periods generally used by the Intergovernmental Panel for Climate Change (IPCC) and other regional climate modelling experiments. It runs climate simulations based on three future time periods that are compared with a historical reference period. Available for 1986-2005 reference period, the 50km pixel resolution raster grids are generated for Moderate and High representative concentration pathways (RCPs), climate change scenarios developed by the IPCC for informing global and regional climate modelling work: RCP4.5 and RCP8.5.
-

Part of the Integrated Vulnerability Assessment in the Arab Region, this 1km pixel resolution raster dataset provides a representation of future change in vulnerability hotspots for Agriculture:Water Available for Crops sub-sector, in the Middle East and North Africa Region. The Raster grid was generated for representative concentration pathway (RCP8.5), high emission scenario developed by the Intergovernmental Panel on Climate Change (IPCC) and for Mid-Century (2046-2065) time period. Pixel values are classified according to vulnerability level: class 10 the top 10%, class 20 top 20% and class 30 top 30%. Vulnerability is a concept used to express the complex interaction of climate change effects and the susceptibility of a system to its impacts. The integrated vulnerability assessment methodology is based on an understanding of vulnerability as a function of a system’s climate change exposure, sensitivity and adaptive capacity to cope with climate change effects, consistent with the approach put forward by the IPCC in its Fourth Assessment Report (AR4). It adopts the time periods generally used by the IPCC and other regional climate modelling experiments and runs climate simulations based on future time periods that are compared with a historical reference period.
-
The main sources of information for the species distribution are the habitat description and geographic range contained in the published FAO Catalogues of Species (more details at http://www.fao.org/fishery/fishfinder ). Terms used in the descriptive context of the FAO Catalogues were converted in standard depth, geographic and ecological regions and inserted into a Geographic Information System.
-
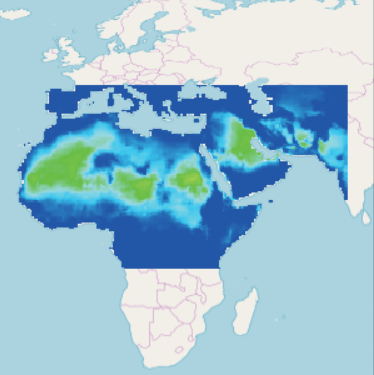
RICCAR, MENA Region - Vulnerability Assessment Exposure Indicators (HYPE RHM Output - Reference Period) This raster dataset provides a representation of the exposure indicators derived from hydrological model Hydrological Predictions for the Environment (HYPE) in the Middle East and North Africa Region, for the reference period 1986-2005. In the context of climate change, exposure refers to changes in climate parameters that might affect socio-ecological systems. Using on the open-source hydrological model HYPE and bias-corrected Regional Climate Models (RCM) results as inputs, the Regional Hydrological Model (RHM) ensemble is employed to assess hydrological change based on future climate projections. The RHM ensemble adopts the same time periods used by the Intergovernmental Panel for Climate Change (IPCC) and other regional climate modelling experiments. It runs climate simulations based on three future time periods that are compared with a historical reference period. Available at approximately 1km pixel resolution, for 1986-2005 reference period, the raster grids are generated for moderate and high representative concentration pathways (RCPs), emission scenarios developed by the IPCC for informing global and regional climate modelling work (RCP4.5 and RCP8.5). Grid pixel values are classified according to a level of exposure (1 to 10), for the indicators, Evapotranspiration and Runoff.