 FAO Map Catalog
Angola
Type of resources
Available actions
Topics
Keywords
Contact for the resource
Provided by
Formats
Representation types
Update frequencies
status
Scale
Resolution
-
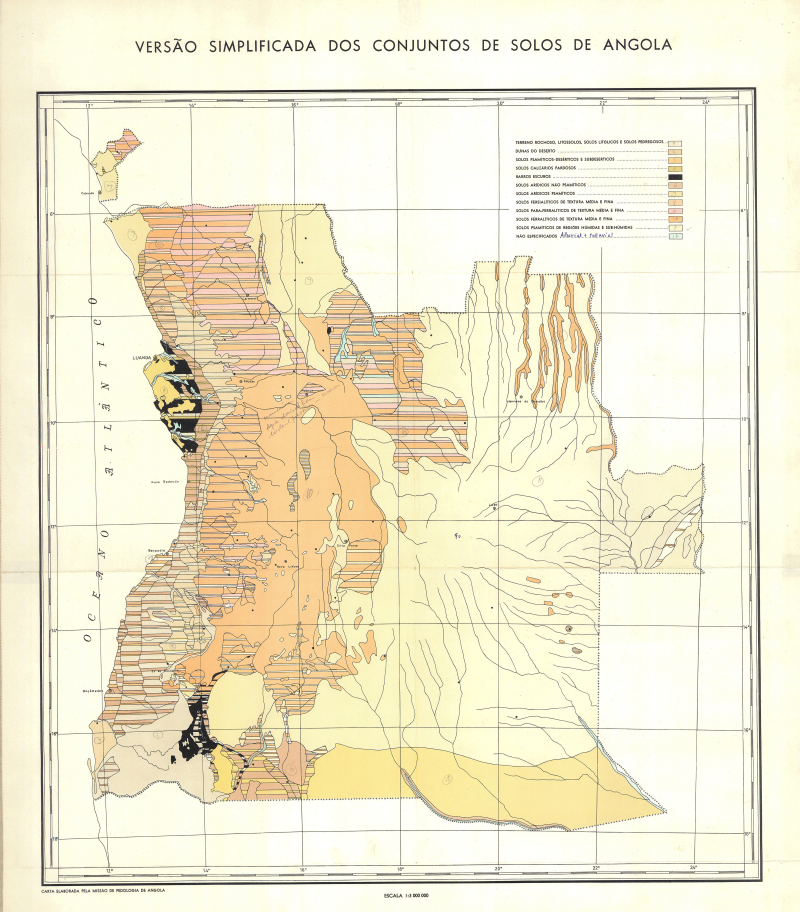
Simplified soil map of Angola
-

Fao-Unesco classification
-

Accessibility to ports dataset is modeled as raster-based travel time/cost analysis. The model travel time/cost from/to ports is defined for major maritime ports only. This 500m resolution raster dataset is part of FAO’s Hand-in-Hand Initiative, Geographical Information Systems - Multicriteria Decision Analysis (GIS-MCDA) aimed at the identification of value chain infrastructure sites (optimal location).
-
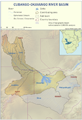
Delineation of the Cubango-Okavango river topographic basin, with identification of sub-basins of interest for the Water Audit project and agreed by OKACOM (Okavango River Basin Commission). This delineation builds on that performed for the EPSMO project and identifies sub-basins relevant for the integrated transboundary management of the basin.
-

The raster dataset represents top location score areas suitable for maize storage filtered by exclusive criteria: access to finance, distance to major roads and access to IT (mobile broadband connection). Access to finance and roads are defined using a linear distance threshold: • Banks - approx. 20km (0.18 degree) buffer radius. • Major roads - approx. 2km (0.018 degree) buffer radius. Access to IT is characterized applying the mobile broadband coverage map. The location score is achieved by processing sub-model outputs characterizing logistical factors for crop warehouse siting: Supply, demand, Infrastructure/accessibility. The location score from 0 to 100 is then obtained through a simple arithmetic weighted sum of the normalized/scaled grids. The top 99th percentile is selected/clipped using the exclusive criteria. This 500m resolution raster dataset is part of FAO’s Hand-in-Hand Initiative, Geographical Information Systems - Multicriteria Decision Analysis (GIS-MCDA) aimed at the identification of value chain infrastructure sites (optimal location).
-
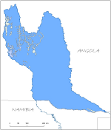
Delineation of aquifer systems in Angola, that share geographical overlapping with the Okavango Basin. Source: Generated for the EPSMO project based on hydrogeological map of Angola provided by Direccao de Geologia e Minas at 1/1000000. This dataset is part of the GIS Database for the Environment Protection and Sustainable Management of the Okavango River Basin project (EPSMO). Detailed information on the database can be found in the “GIS Database for the EPSMO Project†document produced by Luis Veríssimo (FAO consultant) in July 2009, and here available for download.
-

The raster dataset consists of a 500m score grid for banana storage location achieved by processing sub-model outputs that characterize logistical factors for selected crop warehouse location: • Supply: Banana. • Demand: Human population density, Major cities population (national and bordering countries). • Infrastructure/accessibility: main transportation infrastructure. It consists of an arithmetic weighted sum of normalized grids (0 to 100): ("Crop Production" * 0.4) + ("Human Population Density" * 0.2) + ("Major Cities Accessibility" * 0.2) + (“Asset Wealth” * 0.1) + ("Major Ports Accessibility" * 0.1). This 500m resolution raster dataset is part of FAO’s Hand-in-Hand Initiative, Geographical Information Systems - Multicriteria Decision Analysis (GIS-MCDA) aimed at the identification of value chain infrastructure sites (optimal location).
-
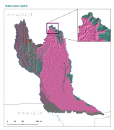
This vector layer represents the geologic units in the CORB-Contributing area of Angola. Source: Data provided by SINFIC, based on the Topographic Map of Angola (Laboratorio Nacional de Investigação Científica Tropica, 1982). This dataset is part of the GIS Database for the Environment Protection and Sustainable Management of the Okavango River Basin project (EPSMO). Detailed information on the database can be found in the “GIS Database for the EPSMO Project†document produced by Luis Veríssimo (FAO consultant) in July 2009, and here available for download.
-

The 500m raster dataset represents selected top location score areas filtered by exclusive criteria: access to finance, distance to major roads, access to IT, and distance to urban areas. The layer was produced under the scope of FAO’s Hand-in-Hand Initiative, Geographical Information Systems - Multicriteria Decision Analysis for value chain infrastructure location. The location score is achieved by processing sub-model outputs characterizing logistical factors for the slaughterhouse facilities siting: Demand, Supply, Infrastructure/accessibility. The top 99th percentile is selected/clipped using the exclusive criteria. Access to finance, distance to roads and urban areas are defined using a linear distance threshold: • Banks - approx. 20km (0.18 degree) buffer radius. • Major roads - approx. 2km (0.018 degree) buffer radius. • Access to IT is characterized by applying the mobile broadband coverage map.
-

The raster dataset represents top location score areas suitable for vegetables storage filtered by exclusive criteria: access to finance, distance to major roads and access to IT (mobile broadband connection). Access to finance and roads are defined using a linear distance threshold: • Banks - approx. 20km (0.18 degree) buffer radius. • Major roads - approx. 2km (0.018 degree) buffer radius. Access to IT is characterized applying the mobile broadband coverage map. The location score is achieved by processing sub-model outputs characterizing logistical factors for crop warehouse siting: Supply, demand, Infrastructure/accessibility. The location score from 0 to 100 is then obtained through a simple arithmetic weighted sum of the normalized/scaled grids. The top 99th percentile is selected/clipped using the exclusive criteria. This 500m resolution raster dataset is part of FAO’s Hand-in-Hand Initiative, Geographical Information Systems - Multicriteria Decision Analysis (GIS-MCDA) aimed at the identification of value chain infrastructure sites (optimal location).