 FAO Map Catalog
dataset
Type of resources
Available actions
Topics
Keywords
Contact for the resource
Provided by
Years
Formats
Representation types
Update frequencies
status
Scale
Resolution
-

The raster dataset represents top location score areas suitable for wheat storage filtered by exclusive criteria: access to finance, distance to major roads and access to IT (mobile broadband connection). The location score is achieved by processing sub-model outputs characterizing logistical factors for crop warehouse siting: Supply, demand, Infrastructure/accessibility. The top score is selected/clipped using the exclusive criteria. Access to finance and roads are defined using a linear distance threshold: • Banks - approx. 20km (0.18 degree) buffer radius. • Major roads - approx. 2km (0.018 degree) buffer radius. Access to IT is characterized applying the mobile broadband coverage map. This 500m resolution raster dataset is produced under the scope of FAO’s Hand-in-Hand Initiative, Geographical Information Systems - Multicriteria Decision Analysis (GIS-MCDA) aimed at the identification of value chain infrastructure sites (optimal location).
-

The raster dataset consists of a 500m score grid for wheat storage location achieved by processing sub-model outputs that characterize logistical factors for selected crop warehouse location: • Supply: Wheat. • Demand: Human population density, Major cities population (national and bordering countries). • Infrastructure/accessibility: main transportation infrastructure. It consists of an arithmetic weighted sum of normalized grids (0 to 100): ("Crop Production" * 0.4) + ("Human Population Density" * 0.2) + ("Major Cities Accessibility" * 0.1) + (“Poverty” * 0.1) + ("Major Ports Accessibility" * 0.1)+("Major Regional Cities Accessibility" * 0.1). This 500m resolution raster dataset is part of FAO’s Hand-in-Hand Initiative, Geographical Information Systems - Multicriteria Decision Analysis (GIS-MCDA) aimed at the identification of value chain infrastructure sites (optimal location).
-
-
The main sources of information for the species distribution are the habitat description and geographic range contained in the published FAO Catalogues of Species (more details at http://www.fao.org/fishery/fishfinder ). Terms used in the descriptive context of the FAO Catalogues were converted in standard depth, geographic and ecological regions and inserted into a Geographic Information System.
-

The seasonal Gross Biomass Water Productivity expresses the quantity of output (above ground biomass production) in relation to the total volume of water consumed (actual Evapotranspiration) during the growing cycle of the vegetation. By relating biomass production to total Evapotranspiration (sum of soil evaporation, canopy transpiration and interception), this indicator provides insights on the impact of vegetation development on consumptive water use and thus on water balance in a given domain. When the focus is on monitoring performance of irrigated agriculture in relation to water consumption, it is more appropriate to use transpiration alone as a denominator, as a measure of water beneficially consumed by the plant. This latter indicator, for which we use the term \"net water productivity\", provides useful information on how effectively vegetation (and particularly crops) uses water to develop its biomass (and thus yield). The data is provided in near real time from January 2009 to present.
-
The Evaporation (E) data component (dekadal, in mm/day) is the actual evaporation of the soil surface. The value of each pixel represents the average daily actual evaporation for that specific dekad. The data is provided in near real time from January 2009 to present.
-
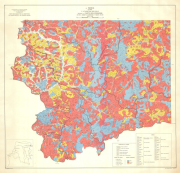
Include: Carte des érosions
-

The raster dataset consists of a 1km score grid for maize storage location achieved by processing sub-model outputs that characterize logistical factors for selected crop warehouse location: • Supply: Crop. • Demand: Human population density, Major cities population (national and bordering countries). • Infrastructure/accessibility: main transportation infrastructure. It consists of an arithmetic weighted sum of normalized grids (0 to 100): ("Crop Production" * 0.4) + ("Human Population Density" * 0.2) + ("Port Accessibility" * 0.2) + (“Major Cities Weighted Accessibility” * 0.1) + (”Regional Cities Weighted Accessibility” * 0.1) This 1km resolution raster dataset is part of FAO’s Hand-in-Hand Initiative, Geographical Information Systems - Multicriteria Decision Analysis (GIS-MCDA) aimed at the identification of value chain infrastructure sites (optimal location).
-
Include: Wariyapola (Map 35)