 FAO Map Catalog
environment
Type of resources
Available actions
Topics
Keywords
Contact for the resource
Provided by
Years
Formats
Representation types
Update frequencies
status
Scale
Resolution
-
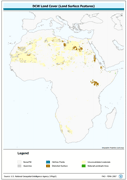
Harmonized bathymetry, coast-line and terrestrial elevation. The AF_LCSRF shapefile data layer is comprised of 7682 derivative vector physiography - hypsography features derived based on 1:1 000 000 data originally from DCW. The layer provides nominal analytical/mapping at 1:1 000 000. Acronyms and Abbreviations: DCW - Digital Chart of the World.
-

This vector layer represents the Okavango Delta System Ramsar site within the Okavango River Basin. Source: The RAMSAR Convention on Wetlands. This dataset is part of the GIS Database for the Environment Protection and Sustainable Management of the Okavango River Basin project (EPSMO). Detailed information on the database can be found in the “GIS Database for the EPSMO Project†document produced by Luis Veríssimo (FAO consultant) in July 2009, and here available for download.
-
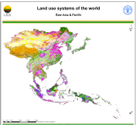
Beta version of a thematic grid of Land Use Systems (LUS) and its attributes for East Asia and Pacific with a spatial resolution of 5 arc minutes or 0.083333 decimal degrees. This dataset, presented as beta version, is developed in the framework of the LADA project (Land degradation Assessment in Drylands) by the Land Tenure and Management Unit of the Food and Agriculture Organization of the United Nations and is copyright of FAO/UNEP GEF. The LUS map implementation is based on a innovative methodology combining more than 10 global datasets. Due to the map generation method, the quality of the map can never be uniform. The overall quality of the map depends heavily on the individual quality of the data for the different countries.
-
This map, compiled to support the analysis of SOLAW report concerning trends and current use of water use in agriculture, shows the percentage of irrigated area supplied by groundwater. Irrigation mainly relies on renewable freshwater resources, either surface water or groundwater. However, while the extent of irrigation and related water uses are reported in statistical databases or by model simulations, information on the source of irrigation water is still very rare. A recent global inventory undertaken by FAO and the University of Bonn reports that 113 million ha, or 38 percent of the total area equipped for irrigation of 301 million ha, is irrigated by groundwater (Siebert et al, 2010).
-

This map provides a representation of levels of water scarcity by major hydrological basin, expressed in terms of the ratio between irrigation water that is consumed by plants through evapotranspiration and renewable fresh water resources. Contrarily to previous water scarcity maps, this map uses consumptive use of water rather than water withdrawal. Renewable fresh water resources as well as net irrigation water requirements in the river basin are calculated through a water balance model, with information regarding climate, soils and irrigated agriculture as input data. The legend distinguishes three classes: • Water scarcity in river basins where evapotranspiration due to irrigation is less than 10% of the total renewable water resources is classified as low; • Water scarcity in river basins where evapotranspiration due to irrigation is in between 10% and 20% of the total renewable water resources is classified as moderate; • Water scarcity in river basins where evapotranspiration due to irrigation is more than 20% of the total renewable water resources is classified as high.
-
The map presents soil quality ratings computed in GAEZ 2009 (IIASA/FAO GAEZ 2009 modelling framework) for low input farming conditions. Natural fertility status of soils as presented above may have further deteriorated over time through ânutrient miningâ. Given proper soil management with appropriate fallowing, the natural status may be restored in the long run.
-
This dataset represents the potential SOC (Soil Potential Carbon) stock for topsoil in 2100 (long term) under A1FI IPCC emission scenario. It is function of re-spatialization of mean actual SOC stock for topsoil according to changes in land use and climate zone in 2100 under A1FI. Classes of stock are as below: - Very low (<15 Mg/ha); - Low (15-40 Mg/ha); - Medium (40-70 Mg/ha); - High (70-140 Mg/ha); - Very high (>140 Mg/ha).
-
This dataset represents the potential GAP in SOC (Soil Potential Carbon) stock for subsoil in 2100 (long term) under B1 IPCC emission scenario. GAP is expressed in terms of class differences between ACTUAL and POTENTIAL subsoil carbon sequestration under the same scenario ans time frame.
-
This dataset represents the potential GAP in SOC (Soil Potential Carbon) stock for topsoil in 2100 (long term) under A1FI IPCC emission scenario. GAP is expressed in terms of class differences between ACTUAL and POTENTIAL topsoil carbon sequestration under the same scenario ans time frame.
-
This map shows the extent of land area equipped for irrigation -expressed as percentage- around the turn of the 20th century according to the Global Map of Irrigation Areas (version 4.0.1), together with areas of rainfed agriculture. Data are available from AQUASTAT - programme of the Land and Water Division of the Food and Agriculture Organization of the United Nations.