 FAO Map Catalog

Type of resources
Available actions
Topics
Keywords
Contact for the resource
Provided by
Years
Formats
Representation types
Update frequencies
status
Scale
Resolution
-
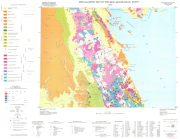
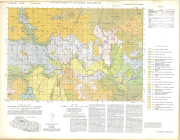
Metallogenic map of the Qena quadrangle, Egypt
-
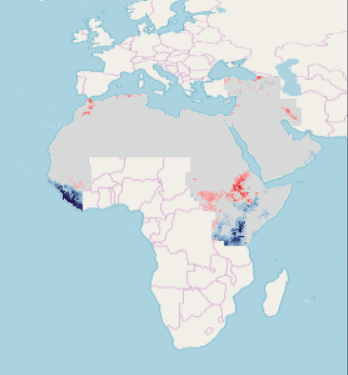
Vulnerable population identified by prevalence of diseases indicator in East Africa - ClimAfrica WP5
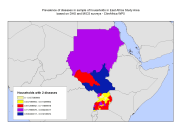
Vulnerable population identified by the prevalence of diseases (malaria, cough and diarrhea) as indicator for food security, in sample of households in East Africa study area. Data based on DHS and MICS surveys. In defining vulnerability, WFP (2009) and IFPRI (2012) have been followed and combined with indicators for food security with health indicators that signal vulnerability in a physical sense. IFPRI's Global Hunger Index uses three indicators to measure hunger: the number of adults being undernourished, the number of children that have low weight for age, and child mortality. Other classifications of food security use the variety of the diet as an indicator, combined with anthropometric data on children. However, in the DHS data there were no information available on child mortality, nor on dietary composition. Given these data limitations, data on nutritional status of women (Body Mass Index, BMI) for women and children (weight for age and weight for height) have been used as indicators for food security. These data were combined with data on morbidity among adults and children, specifically the occurrence of malaria, cough, and diarrhea. Combinations of indicators have led to a classification of households as being very vulnerable, vulnerable, nearly vulnerable and not vulnerable. This data set was produced in the framework of the "Climate change predictions in Sub-Saharan Africa: impacts and adaptations (ClimAfrica)" project, Work Package 5 (WP5). More information on ClimAfrica project is provided in the Supplemental Information section of this metadata. This study in WP5 aimed to identify, locate and characterize groups that are vulnerable for climate change conditions in two country clusters; one in West Africa (Benin, Burkina Faso, Côte d'Ivoire, Ghana, and Togo) and one in East Africa (Sudan, South Sudan and Uganda). Data used for the study include the Demographic and Health Surveys (DHS) , the Multi Indicator Cluster Survey (MICS) and the Afrobarometer surveys for the socio-economic variables and grid level data on agro-ecological and climatic conditions.
-
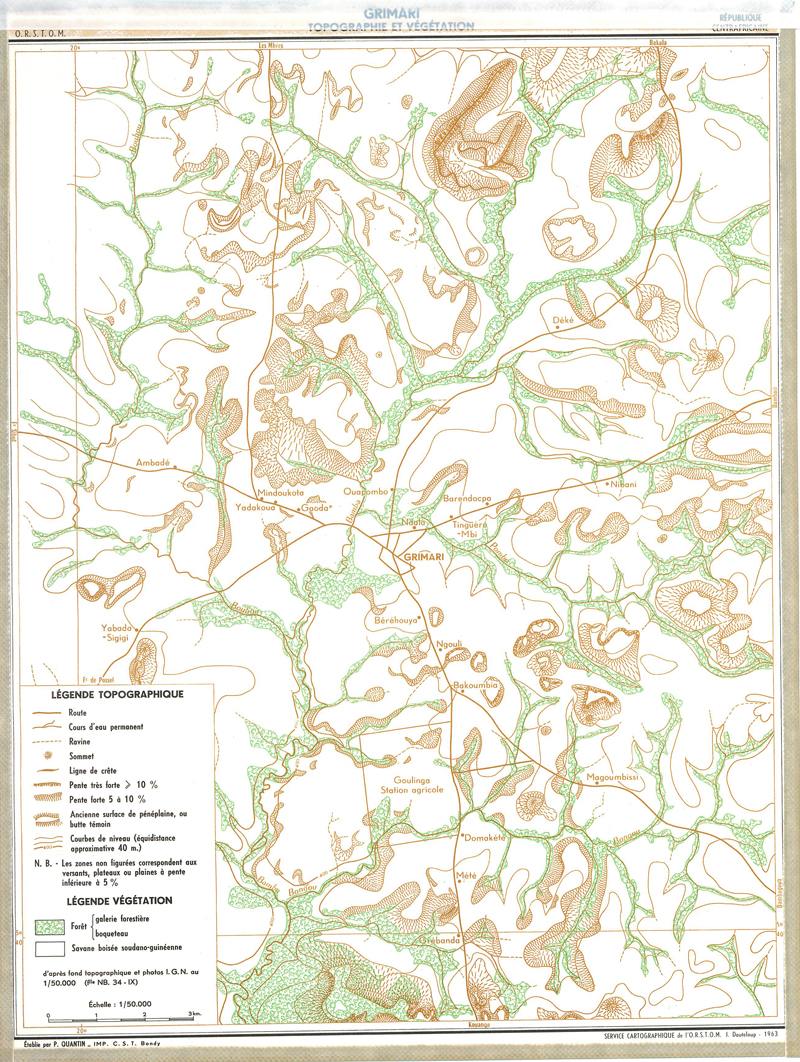
Topographie et végétation, Grimari
-
**Table content** - Year - Indicator code - ITEM (code) - Value - Flag - Unit of measure code
-

Carte des associations des sols du Burkina Faso
-
This raster dataset provides a representation of the change in Monthly Runoff in the Middle East and North Africa Region. Bias-corrected Regional Climate Models (RCM) results serve as inputs for the generation of the Regional Hydrological Model (RHM) ensemble using the open-source hydrological model HYPE (Hydrological Predictions for the Environment). The RHM is applied to assess hydrological change using future climate projections and can accommodate large datasets spanning timescales exceeding 100 years. The RHM ensemble adopts the time periods used by the Intergovernmental Panel for Climate Change (IPCC) and other regional climate modelling experiments. It runs climate simulations based on three future time periods that are compared with a historical reference period. Available at 0,19 degree (approx. 21km) pixel resolution, for future time periods; Near, Mid and End-century, the raster grids are generated for moderate and high representative concentration pathways (RCPs), climate change scenarios developed by the IPCC for informing global and regional climate modelling work (RCP4.5 and RCP8.5). The adopted time periods are: Near-Century (2016-2035); Mid-Century (2046-2065); End-Century (2081-2100).
-
Include: Soil map of the project area, Belitang, Land capability map of the project area, Belitang
-
Include: El Paraiso (2358 II) - Soil Maps; Description of the mapping units
-
**Table content** - year - indicateur - product - value - flag - unit **Value assigned to No-data**:m
-
The Food and Agriculture Organization of the United Nations (FAO) with the collaboration of the International Institute for Applied Systems Analysis (IIASA), has developed a system that enables rational land-use planning on the basis of an inventory of land resources and evaluation of biophysical limitations and potentials. This is referred to as the Agro-ecological Zones (AEZ) methodology.