 FAO Map Catalog
society
Type of resources
Available actions
Topics
Keywords
Contact for the resource
Provided by
Years
Formats
Representation types
Update frequencies
status
Scale
Resolution
-
The FGGD high resolution rural settlements population density map is a global raster datalayer with a resolution of 30 arc-seconds. Each pixel classified as rural by the urban area boundaries map but having a population density value of 2000 or above, contains the number of persons per square kilometre. All remaining pixels contain no data. The method used by FAO to generate this datalayer is described in FAO, 2006, Mapping global urban and rural population distributions, by M. Salvatore, et. al.
-
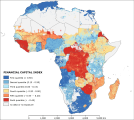
The “financial capital index” represents the economic means that determine the potential adaptive capacity degree of a particular unit of analysis in 2010. It is linked with the richness and the attained degree of economical development of a certain population. It is the combination of two underlying indexes: the “financial development index” and the “richness index”. These original indexes correspond to the two principal components identified by Principal Component Analysis among 9 potential variables. The analysis assigned relative weights to the “financial development index” and the “richness index”, that are 0.51 and 0.49, respectively. This dataset has been produced in the framework of the “Climate change predictions in Sub-Saharan Africa: impacts and adaptations (ClimAfrica)” project, Work Package 4 (WP4). More information on ClimAfrica project is provided in the Supplemental Information section of this metadata. This dataset has been produced in the framework of the “Climate change predictions in Sub-Saharan Africa: impacts and adaptations (ClimAfrica)” project, Work Package 4 (WP4). More information on ClimAfrica project is provided in the Supplemental Information section of this metadata.
-
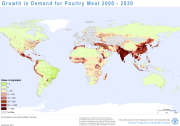
Livestock is one of the fastest-growing sectors in agriculture, potentially presenting opportunities for economic growth and poverty reduction in rural areas. Dealing with the important social, environmental and public health issues linked to sector growth will require solutions that embrace the way in which the livestock sector grows to meet the increasing demand for animal-source foods. It is then important to understand where growth in demand for livestock commodities is likely to occur, and how and where production of livestock commodities will be increased in order to meet it. Estimates of supply and demand for animal-source foods, provided by the Global Perspective Studies Unit at FAO, have been disaggregated spatially for the years 2000 and 2030. Demand for animal-source foods (beef, milk, mutton, pork, poultry meat and eggs) was mapped by estimating per-capita consumption and applying this to mapped population distributions in 2000. Population maps were produced for 2030 based on projected population growth and urbanisation rates and future estimates of per-capita demand applied to these. Similarly, livestock production maps were produced by spatially disaggregating the estimated production based on maps of the relevant livestock species. Methods and results are presented in the forthcoming FAO working paper âMapping Supply and Demand for Animal-Source Foods to 2030 (by T.P. Robinson and F. Pozzi, 2011). Grids and tabular data are distributed here by livestock product and by continent.
-
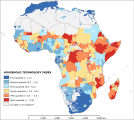
The “household technology index” relates to the diffusion of daily necessity technology in a certain area in 2010. High rate of access to such technology is an indicator of quality of life and wellbeing condition of the population, and thus, those with the capacity to cope and face better climate change impacts. The index results from the first cluster of the Principal Component Analysis preformed among 10 potential variables. The analysis identifies four dominant variables, namely “access to improved water source”, “access to improved sanitation facilities”, “electrification rate” and “mobile phone subscriptions”, assigning an equal weight of 0.25 to the four variables. Before to perform the analysis “electrification rate” and “mobile phone penetration” were log transformed to shorten the extreme variation and then with the other two variable were score-standardized (converted to distribution with average of 0 and standard deviation of 1) in order to be comparable. The first administrative level data for the “access to improved water source” (the share of the population with reasonable access to any of the following types of water supply for drinking: household connections, public standpipes, boreholes, protected dug wells, protected springs and rainwater collection. Reasonable access is defined as the availability of at least 20 liters a person per day from a source within one kilometer of the user’s dwelling.) and “access to improved sanitation facilities” (the share of the population with access to comprise flush toilets, piped sewer systems, septic tanks, flush/pour flush to pit latrines, ventilated improved pit latrines, pit latrines with slab and composting toilets) were gathered from DHS, UNDP National Human Development Reports, WHO/UNICEF statistics, and in some cases national survey data (data range from 1998 to 2012). Tabular data were linked by first administrative unit to the first administrative boundaries shapefile (FAO/GAUL) and then converted into raster format (resolution 0.5 arc-minute). The first administrative level data for the “electrification rate” of 2006 (percentage of population with access to electricity) was produced by NOAA National Geophysical Data Center. It is an estimation based on night light satellite picture. Tabular data were linked by first administrative unit to the first administrative boundaries shapefile (FAO/GAUL) and then converted into raster format (resolution 0.5 arc-minute). The country based data for the “mobile phone subscriptions” were gathered from World Bank. It records the average number of subscriptions to a public mobile telephone service using cellular technology per 100 people in the period 2008-2012. Post-paid and prepaid subscriptions are included. Tabular data were linked by country unit to the national boundaries shapefile (FAO/GAUL) and then converted into raster format (resolution 0.5 arc-minute). These variables have been identified as a key indicator of adaptive capacity, and thus vulnerability, at many levels by different authors (e.g. Brooks et al. 2005; Bollin & Hidajat 2006). In particular improved sanitation facilities prevent insect and animal contact, which are agents of diarrhea, and also reduce other non-diarrhea related health outcomes. Improved water sources can significantly lower the risk of water-borne diseases, which, in turn, has in its turn a positive impact on people's health status (Esrey & Habicht 1986). In other words, improved sanitation facilities and water sources should get better growth rates and reduce child mortality rates. This dataset has been produced in the framework of the “Climate change predictions in Sub-Saharan Africa: impacts and adaptations (ClimAfrica)” project, Work Package 4 (WP4). More information on ClimAfrica project is provided in the Supplemental Information section of this metadata.
-
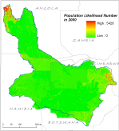
Population database compiled on a 30x30†lat/long grid, for the years: 1998, 2000 and 2007. within the Okavango Basin. Census counts (at sub-national level) were apportioned to each grid cell based on likelihood coefficients, which are based on proximity to roads, slope, land cover, nighttime lights, and other information.Source: Oak Ridge National Laboratory (ORNL). This dataset is part of the GIS Database for the Environment Protection and Sustainable Management of the Okavango River Basin project (EPSMO). Detailed information on the database can be found in the “GIS Database for the EPSMO Project†document produced by Luis Veríssimo (FAO consultant) in July 2009, and here available for download.
-
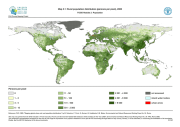
The FGGD rural population distribution map is a global raster datalayer with a resolution of 5 arc-minutes. Each pixel classified as rural by the urban area boundaries map contains a numeric count of persons in the land area represented by the pixel, aggregated from the 30 arc-second datalayer. All remaining pixels contain no data. The method used by FAO to generate this datalayer is described in FAO, 2005, Mapping global urban and rural population distributions, by M. Salvatore, et. al.
-
As part of the the World Bank's review of its rural development strategy, the Bank sought the assistance of the Food and Agriculture Organization of the United Nations (FAO) in evaluating how farming systems might change and adapt over the next thirty years. Amongst other objectives, the World Bank asked FAO to provide guidance on priorities for investment in food security, poverty reduction, and economic growth, and in particular to identify promising approaches and technologies that will contribute to these goals. The results of the study are summarized in a set of seven documents, comprising six regional reports and the global overview contained in this volume. This document, which synthesises the results of the six regional analyses as well as discussing global trends, cross-cutting issues and possible implementation modalities, presents an overview of the complete study. This document is supplemented by two case study reports of development issues of importance to farming systems globally.
-
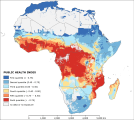
The “public health index” describes the general health status of a certain area in 2010. The degree of health status is an important factor of adaptive capacity because the epidemics deepens poverty, reverses human development achievements, worsens gender inequalities, erodes the ability of governments to maintain essential services, reduces labor productivity and supply, and puts a brake on economic growth. The index results from the first cluster of the Principal Component Analysis preformed among 16 potential variables. The analysis identify four dominant variables, namely “TBC incidence”, “Plasmodium entomological inoculation rate”, “Plasmodium endemic rate” and “Tsetse fly potential habitat”, assigning respectively the weights of 0.2, 0.28, 0.26 and 0.26. Before to perform the analysis all the variables were log transformed to shorten the extreme variation and then were score-standardized (converted to distribution with average of 0 and standard deviation of 1; all variables with inverse method) in order to be comparable. Country-based data of TBC incidence were collected from World Bank. In particular the average of the period 2008-2012 was computed. Tabular data were linked by country to the national boundaries shapefile (FAO/GAUL) and then converted into raster format (resolution 0.5 arc-minute). The 0.5 arc-minute grids on “Plasmodium entomological inoculation rate” and “Plasmodium endemic rate”, produced by Malaria Atlas Project of Oxford University, measure the intensity of malaria transmission in 2010. The first is the number of P. falciparum infective bites received by an individual annually, while the second mapped the age-standardized P. falciparum Parasite Rate which describes the estimated proportion of 2-10 year olds in the general population that are infected with P. falciparum at any one time, averaged over the 12 months of 2010. The 3 arc-minute grid “Tsetse fly potential habitat” were gathered from the three fly groups for 1999 from FAO geonetwork and then was sampled at 0.5 arc-minute. TBC, Tsetse and malaria are important diseases in Africa and thus are main thread to adaptive capacity enhancement in Africa. Areas with large diffusion of such epidemic diseases have weak resilience degree and low capacity to implement climate change adaptation actions. This dataset has been produced in the framework of the “Climate change predictions in Sub-Saharan Africa: impacts and adaptations (ClimAfrica)” project, Work Package 4 (WP4). More information on ClimAfrica project is provided in the Supplemental Information section of this metadata.
-
As part of the the World Bank's review of its rural development strategy, the Bank sought the assistance of the Food and Agriculture Organization of the United Nations (FAO) in evaluating how farming systems might change and adapt over the next thirty years. Amongst other objectives, the World Bank asked FAO to provide guidance on priorities for investment in food security, poverty reduction, and economic growth, and in particular to identify promising approaches and technologies that will contribute to these goals. The results of the study are summarized in a set of seven documents, comprising six regional reports and the global overview contained in this volume. This document, which synthesises the results of the six regional analyses as well as discussing global trends, cross-cutting issues and possible implementation modalities, presents an overview of the complete study. This document is supplemented by two case study reports of development issues of importance to farming systems globally.
-
As part of the the World Bank's review of its rural development strategy, the Bank sought the assistance of the Food and Agriculture Organization of the United Nations (FAO) in evaluating how farming systems might change and adapt over the next thirty years. Amongst other objectives, the World Bank asked FAO to provide guidance on priorities for investment in food security, poverty reduction, and economic growth, and in particular to identify promising approaches and technologies that will contribute to these goals. The results of the study are summarized in a set of seven documents, comprising six regional reports and the global overview contained in this volume. This document, which synthesises the results of the six regional analyses as well as discussing global trends, cross-cutting issues and possible implementation modalities, presents an overview of the complete study. This document is supplemented by two case study reports of development issues of importance to farming systems globally.