 FAO Map Catalog
environment
Type of resources
Available actions
Topics
Keywords
Contact for the resource
Provided by
Years
Formats
Representation types
Update frequencies
status
Scale
Resolution
-

Compilation of FAO Soil great group and major attribute characteristics with country boundaries removed. The SOILS_PY shapefile data layer is comprised of 4909 derivative vector soils features derived based on 1:5 000 000 data originally from FAO. Acronyms and Abbreviations: FAO - Food and Agriculture Organization in the United Nations.
-
This dataset represents the potential GAP in SOC (Soil Potential Carbon) stock for topsoil in 2050 (medium term) under B1 IPCC emission scenario. GAP is expressed in terms of class differences between ACTUAL and POTENTIAL topsoil carbon sequestration under the same scenario ans time frame.
-
Main rivers over the study area of Mindanao island of Philippines.
-

The map shows the results of a simulation of land suitability assessment under climate change impacts on land resources. The map was compiled from climate projections and calculations produced by the UK Hadley Centre (GCM results from the UK HadCM3 model for the 2050s for an emission pathway of the IPCC SRES A2 scenario (Nakicenovic et al., 2000)). The impacts of climate change on the production potential of rain-fed cereals in current cultivated land are represented in the map for all the types of cereals represented in GAEZ 2009 (some 118 cereal LUTs covering wheat, rice, maize, barley, sorghum, millet, rye, oats and buckwheat). The computations determine separately for current climate and for future climate conditions the most productive cereal type in each grid-cell of the spatial resource inventory in order to define overall cereal productivity, i.e. assuming a high level of crop adaptation. Results indicate a somewhat increasing global rain-fed production potential by 2050, provided CO2 fertilization is effective and full adaptation of crop types is achieved; but climate change could as well result in a reduction of the global production of about 5 percent if these two aspects were not achieved. In the latter case most regions would experience a reduction. At the regional level, results for Southern Africa, North Africa and Central America show the largest negative climate change impacts on rain-fed cereal production potential. The suitability combines and classifies within grid cell the obtained suitability distribution by means of an index. This index is calculated as follows; SI= VS*0.9+ S*0.7+MS*0.5+mS*0.3+ VmS*0.1 Where: VS represents the share of very suitable land (80-100% of maximum attainable yield) S represents the share of suitable land (60-80% of attainable yield) MS represents the share of moderately suitable land (40-60% of maximum attainable yield) mS represents the share of marginally suitable land (20-40% of maximum attainable yield) VmS represents the share of very marginally suitable land (5-20% of maximum attainable yield)
-

The Congo forest cover change map 2000-2012 was created by the national forest services of Congo (CNIAFF) in collaboration with UN-REDD programme. It builds on 3 existing products that are combined to comply with the national forest definition (30% tree cover, 0.5 ha MMU). It is stratified into 3 forest types (Primary, Secondary, Primary/Swamp)
-
This dataset represents the potential GAP in SOC (Soil Potential Carbon) stock for subsoil in 2100 (long term) under B1 IPCC emission scenario. GAP is expressed in terms of class differences between ACTUAL and POTENTIAL subsoil carbon sequestration under the same scenario ans time frame.
-
This dataset represents the potential SOC (Soil Potential Carbon) stock for topsoil in 2100 (long term) under A1FI IPCC emission scenario. It is function of re-spatialization of mean actual SOC stock for topsoil according to changes in land use and climate zone in 2100 under A1FI. Classes of stock are as below: - Very low (<15 Mg/ha); - Low (15-40 Mg/ha); - Medium (40-70 Mg/ha); - High (70-140 Mg/ha); - Very high (>140 Mg/ha).
-
This dataset represents the potential SOC (Soil Potential Carbon) stock for subsoil in 2100 (long term) under B1 IPCC emission scenario. It is function of re-spatialization of mean actual SOC stock for subsoil according to changes in land use and climate zone in 2100 under B1. Classes of stock are as below: - Very low (<10 Mg/ha); - Low (10-30 Mg/ha); - Medium (30-50 Mg/ha); - High (50-70 Mg/ha); - Very high (>70 Mg/ha).
-
This dataset represents the potential GAP in SOC (Soil Potential Carbon) stock for subsoil in 2100 (long term) under A1FI IPCC emission scenario. GAP is expressed in terms of class differences between ACTUAL and POTENTIAL subsoil carbon sequestration under the same scenario ans time frame.
-
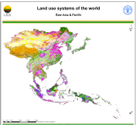
Beta version of a thematic grid of Land Use Systems (LUS) and its attributes for East Asia and Pacific with a spatial resolution of 5 arc minutes or 0.083333 decimal degrees. This dataset, presented as beta version, is developed in the framework of the LADA project (Land degradation Assessment in Drylands) by the Land Tenure and Management Unit of the Food and Agriculture Organization of the United Nations and is copyright of FAO/UNEP GEF. The LUS map implementation is based on a innovative methodology combining more than 10 global datasets. Due to the map generation method, the quality of the map can never be uniform. The overall quality of the map depends heavily on the individual quality of the data for the different countries.