 FAO Map Catalog
FAO-UN
Type of resources
Available actions
Topics
Keywords
Contact for the resource
Provided by
Years
Formats
Representation types
Update frequencies
status
Scale
Resolution
-
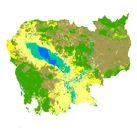
This dataset derived from the full resolution land cover which has been produced from visual interpretation of digitally enhanced Landsat ETM images 2000-2005 followed by the assessment of land cover changes from 1975 to 2005. The mapping scale used for the visual photo-interpretation was 1:100.000. The digital vector files have been processed using FAO/GLCN software suite (MadCat, ADG, LCCS). In order to better show land cover change trends, the following aggregated classes have been created: - Agriculture - Rice - Plantation - Herbaceous vegetation - Shrubs - Evergreen forest - Deciduous forest - Natural flooded areas - Mangrove - Urban areas - Bare areas - Waterbodies Aggregated class "Agriculture" concerns whatever crop is cultivated (cereals, catch crops, orchards, etc.) excluding rice, for which another aggregated class - including both paddy and floating rice - has been created. The other aggregated classes are clearly described by their names. The land cover legend (35 classes) was created by updating the existing data of the former Land Cover map of Cambodia 1992-93. The legend was then converted in standardized classes using the FAO/UNEP Land Cover Classification System (LCCS). Land cover types interpreted included: - 11 classes of cultivated areas - 11 classes of natural vegetation - 7 classes of flooded areas - 1 class of urban areas - 3 classes of bare areas - 2 classes of natural water bodies for a total of 35 LCCS classes List of abbreviations: ADG - Advanced Database Gateway FAO - Food and Agriculture Organization of the United Nations GLCN - Global Land Cover Network LCCS - FAO/UNEP Land Cover Classification System MadCat - Mapping Deviceâ - Change Analysis Tool UNEP - United Nations Environmental Programme
-
Climate Hazards Group InfraRed Precipitation with Station data (CHIRPS) is a 30+ year quasi-global rainfall dataset. CHIRPS incorporates 0.05° resolution satellite imagery with in-situ station data to create gridded rainfall time series for trend analysis and seasonal drought monitoring. Approximately 5km (0.05°) unit: "mm" dataType: "Float32" noDataValue: -9999
-
The Land cover of Cambodia (2005) - full resolution dataset was produced from visual interpretation of digitally enhanced Landsat ETM images acquired mainly in the period 2000-2002 and affined with high resolution images of Google Earth. The mapping scale used for the visual photo-interpretation was 1:100.000. The digital vector files were then processed using FAO/GLCN methodology and tools (MadCat, ADG). The land cover legend (35 classes) was created by updating the existing data of the former Land Cover map of Cambodia 1992-93 and then converted in standardized classes using the FAO/UNEP Land Cover Classification System (LCCS). Land cover types interpreted included: - 11 classes of cultivated areas - 11 classes of natural vegetation - 7 classes of flooded areas - 1 class of urban areas - 3 classes of bare areas - 2 classes of natural water bodies for a total of 35 LCCS classes. The land cover dataset has been followed by the assessment of land cover changes from 1975 to 2005 (see metadata 'Land cover Change of Cambodia' for further details). List of abbreviations: ADG - Advanced Database Gateway FAO - Food and Agriculture Organization of the United Nations GLCN - Global Land Cover Network LCCS - FAO/UNEP Land Cover Classification System MadCat - Mapping Device - Change Analysis Tool UNEP - United Nations Environmental Programme
-
Climate Hazards Group InfraRed Precipitation with Station data (CHIRPS) is a 30+ year quasi-global rainfall dataset. CHIRPS incorporates 0.05° resolution satellite imagery with in-situ station data to create gridded rainfall time series for trend analysis and seasonal drought monitoring. Approximately 5km (0.05°) unit: "mm" dataType: "Float32" noDataValue: -9999
-
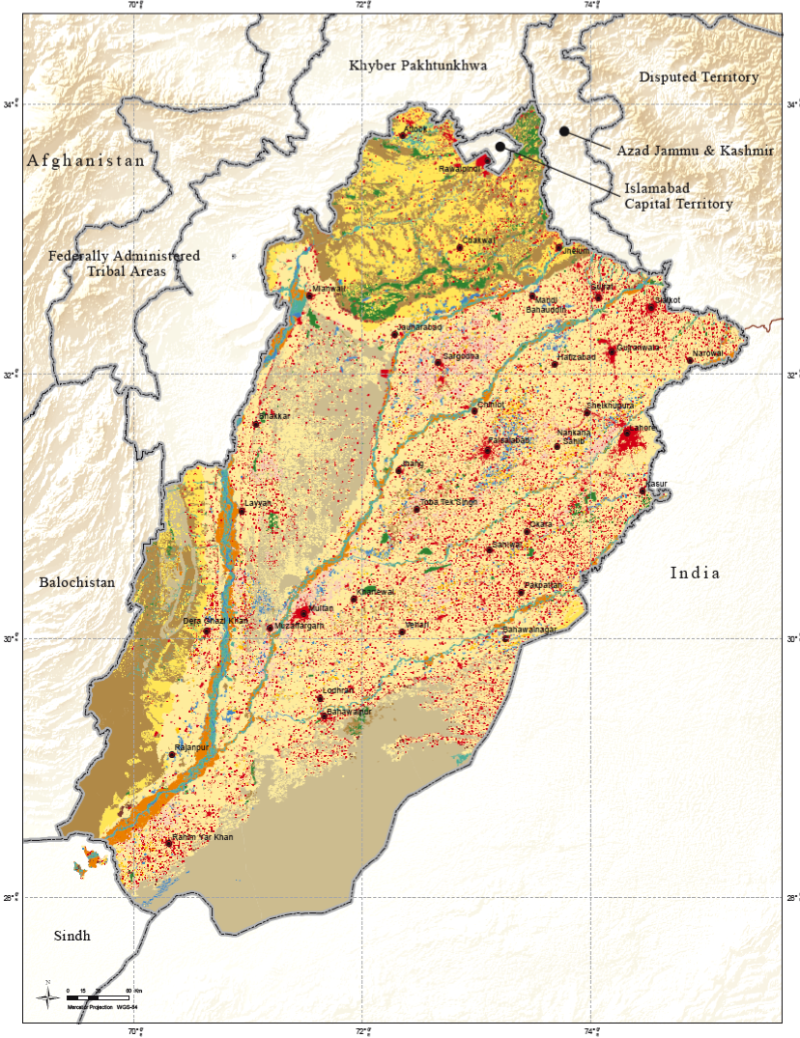
This dataset provides information on the land cover distribution in the Punjab province. The database was created using a number of data sources ranging from remote sensing satellite imagery (at 5 meters resolution or better), available historical digital datasets and in-situ data. The FAO Land Cover Classification System (LCCS) was used for the creation of the national legend in consultation and inputs from the national experts. The legend has 13 main land cover classes which have been further subdivided into 36 classes mapped based on the analysis, interpretation and validation of SPOT -5 very high resolution satellite data (5 metre). The SPOT-5 satellite images were segmented into homogeneous polygons and labelled using the LCCS classification system and adopting the FAO methodology and its land cover toolbox. The Provincial land cover database of Punjab was made possible by the contributions of the partner organizations involved in the project "Agricultural Information System - Building Provincial Capacity in Pakistan for Crop Estimation, Forecasting, and Reporting based on the integral use of Remotely Sensed Data, GCP/PAK/125/USA", the Government of Pakistan, the Food and Agriculture Organization of the United Nations (FAO) and the United States Department of Agriculture (USDA), which funds the Project.
-

Map of dairy cattle GreenHouse Gas (GHG) emissions. Emissions are reported as CO2 eq. emissions, based on a 100 year global warming potential (GWP100 fb cc) conversions factors (which for methane is 34, and for nitrous oxide is 298). Milk production from the dairy cattle sector in Ethiopia accounted for about 116.3 million tonnes CO2 eq. in 2013 (FAO & New Zealand Agricultural Greenhouse Gas Research Centre, 2017). These emissions are distributed throughout the entire country as shown in the map. Approximately 87 % of the emissions arise from methane produced by the rumination of cattle and 10 % from the management of stored manure. Nitrous oxide arising from dung and urine contributes about 2.1 %. The contribution from the production of feed is negligible because the proportion of external inputs such as supplementary feed and fertilizer for feed production is low. Absolute emissions are concentrated in three regions, which together account 80% of the national dairy herd: Oromia (34 %), SNNPR (31 %) and Amhara (14 %). Source: FAO & New Zealand Agricultural Greenhouse Gas Research Centre. 2017. Supporting low emissions development in the Ethiopian dairy cattle sector – reducing enteric methane for food security and livelihoods. Rome. 34 pp. In this map, the Global Livestock Environmental Assessment Model (GLEAM; http://www.fao.org/gleam/en/) is the main analytical tool used to assess the emissions for the baseline year (2013). The spatially explicit GLEAM framework allows the incorporation of heterogeneity in emissions, emission reductions and production responses. The model was further developed to meet the needs of this study for Ethiopia. The dairy production systems in GLEAM were further refined to reflect the specificities of the dairy cattle production systems in Ethiopia and the database of production systems parameters was updated with more recent and system specific information and data on factors such as animal populations, performance parameters, feeding systems and manure management, taken from national databases.
-
This land cover data set is derived from the original raster based Globcover regional (Africa) archive. It has been post-processed to generate a vector version at national extent with the LCCS regional legend (46 classes). This database can be analyzed in the GLCN software Advanced Database Gateway (ADG), which provides a user-friendly interface and advanced functionalities to breakdown the LCCS classes in their classifiers for further aggregations and analysis. The data set is intended for free public access. The shape file's attributes contain the following fields: -Area (sqm) -ID -Gridcode (Globcover cell value) -LCCCode (unique LCCS code) You can download a zip archive containing: -the shape file (.shp) -the ArcGis layer file with global legend (.lyr) -the ArcView 3 legend file (.avl) -the LCCS legend tables (.xls)
-
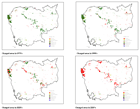
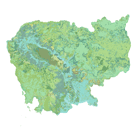
The Cambodia Land Cover Change dataset was obtained from visual comparison of sets of Landsat images (1972/79 - 1989/94 - 2000/02 - 2004/06). The changes detected, concerning mainly variations of agriculture and forest extension, were digitalized as new polygons on the land cover interpretation. In order to better show land cover change trends, the following aggregated classes have been created: - Agriculture - Rice - Plantation - Herbaceous vegetation - Shrubs - Evergreen forest - Deciduous forest - Natural flooded areas - Mangrove - Urban areas - Bare areas - Waterbodies Aggregated class 'Agriculture' concerns whatever crop is cultivated (cereals, catch crops, orchards, etc.) excluding rice, for which another aggregated class - including both paddy and floating rice - has been created. The other aggregated classes are clearly described by their names. The land cover legend (35 classes) was created by updating the existing data of the former Land Cover map of Cambodia 1992-93 and then converted in standardized classes using the FAO/UNEP Land Cover Classification System (LCCS). Land cover types interpreted included: - 11 classes of cultivated areas - 11 classes of natural vegetation - 7 classes of flooded areas - 1 class of urban areas - 3 classes of bare areas - 2 classes of natural water bodies for a total of 35 LCCS classes. The Land Cover Change shapefile's attributes contain the following fields: -Area (sqm) -Perimeter (m) -ID -LCCSCode, LCCSUserlabel, LCCSPerc for years 1975, 1990, 2000, 2005 List of abbreviations: ADG - Advanced Database Gateway FAO - Food and Agriculture Organization of the United Nations GLCN - Global Land Cover Network LCCS - FAO/UNEP Land Cover Classification System MadCat - Mapping Device Change Analysis Tool UNEP - United Nations Environmental Programme
-

Map of total dairy cattle milk production. Total milk production in kg of milk in 2013. Ethiopia produces approximately 3.8 million litres of milk from 12 million milking cows – an average of 1.7 litres per cow per day over an average lactation period of 180 days. In terms of production system contribution to milk production, the rural mixed crop-livestock dairy system produces the largest share of milk, contributing 72% of the total milk supply from 65% of the milking animals. Pastoral and agro-pastoral systems and the market-oriented systems contribute 24% and 4% of the total milk, respectively, with 34% and 1% of the milking cows, respectively. Source: FAO & New Zealand Agricultural Greenhouse Gas Research Centre. 2017. Supporting low emissions development in the Ethiopian dairy cattle sector – reducing enteric methane for food security and livelihoods. Rome. 34 pp. In this map, the Global Livestock Environmental Assessment Model (GLEAM; http://www.fao.org/gleam/en/) is the main analytical tool used to assess the emissions for the baseline year (2013). The spatially explicit GLEAM framework allows the incorporation of heterogeneity in emissions, emission reductions and production responses. The model was further developed to meet the needs of this study for Ethiopia. The dairy production systems in GLEAM were further refined to reflect the specificities of the dairy cattle production systems in Ethiopia and the database of production systems parameters was updated with more recent and system specific information and data on factors such as animal populations, performance parameters, feeding systems and manure management, taken from national databases.
-
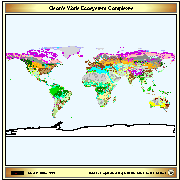
Vector map based on a Digital Raster Data 10-minute Cartesian Orthonormal Geodetic 1080x2160 grid. Source: Global Ecosystems Map by J. S. Olson 1992 (Global Patterns Company) Olson, J.S. 1992. World Ecosystems (WE1.4). Digital Raster Data on a 10-minute Cartesian Orthonormal Geodetic 1080x2160 grid. More information on the source at https://www.ngdc.noaa.gov/ecosys/cdroms/AVHRR97_d2/document/ncillary/owe/aareadme.htm