 FAO Map Catalog
FAO
Type of resources
Available actions
Topics
Keywords
Contact for the resource
Provided by
Years
Formats
Representation types
Update frequencies
status
Scale
Resolution
-

Climate Hazards Group InfraRed Precipitation with Station data (CHIRPS) is a 30+ year quasi-global rainfall dataset. CHIRPS incorporates 0.05° resolution satellite imagery with in-situ station data to create gridded rainfall time series for trend analysis and seasonal drought monitoring. Precipitation anomalies expressed in mm which can be converted into volume for a specific area (1mm=1l/m² or 1mm=10m³/ha). The term "anomaly" means a departure from a reference value or long-term average. For the precipitation anomaly animation, the reference value is the average precipitation over the period 1970-1999. A positive anomaly value indicates that the observed precipitation was greater than the long-term average , while a negative anomaly indicates that the observed precipitation was less than the long-term average. Approximately 5km (0.05°) unit: "mm" dataType: "Float32" noDataValue: -9999
-
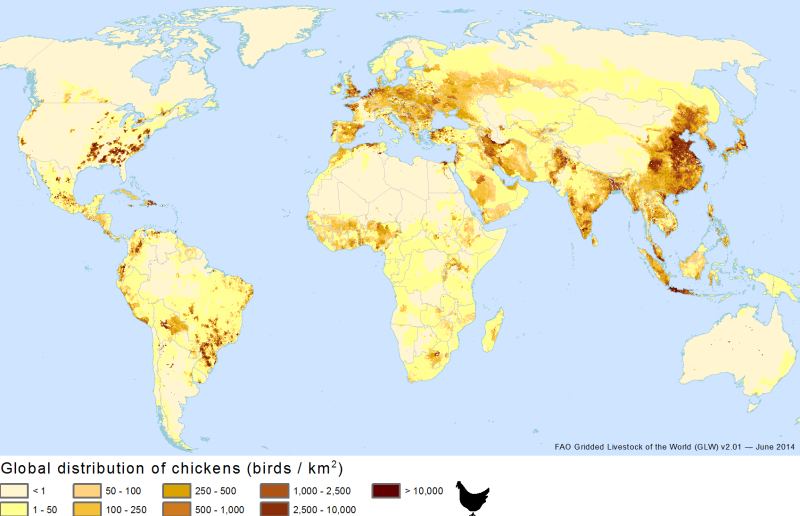
This data-set shows the most recent global model of the chickens distribution. It is the first update (version 2.01) of the recently published Gridded Livestock of the World (GLW) 2.0 (May 2014). More information and access to the data of the GLW version 2.0 are in the dedicated web-site: http://livestock.geo-wiki.org/ The GLW 2007 remains available for download in FAO Geonetwork. However, a quantitative assessment of change is not possible between the GLW 2007 and the GLW 2.0 (and its updates) due to different modeling techniques, spatial resolution, predicting variables and training data. GLW 2.0 and its updates map separately the chickens and the ducks distributions whereas GLW 2007 mapped a single poultry distribution. The bibliographic reference to the GLW 2.0 and its updates is: Robinson TP, Wint GRW, Conchedda G, Van Boeckel TP, Ercoli V, Palamara E, Cinardi G, D’Aietti L, Hay SI, and Gilbert M. (2014) Mapping the Global Distribution of Livestock. PLoS ONE 9(5): e96084. doi:10.1371/journal.pone.0096084 The supplementary information includes a list of the observed data used to train this version of the chickens model.
-
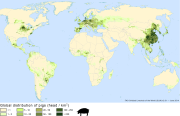
This data-set shows the most recent global model of the pigs distribution. It is the first update (version 2.01) of the recently published Gridded Livestock of the World (GLW) 2.0 (May 2014). More information and access to the data of the GLW version 2.0 are in the dedicated web-site: http://livestock.geo-wiki.org/ The GLW 2007 remains available for download in FAO Geonetwork. However, a quantitative assessment of change is not possible between the GLW 2007 and the GLW 2.0 (and its updates) due to different modeling techniques, spatial resolution, predicting variables and training data. The bibliographic reference to the GLW 2.0 and its updates is: Robinson TP, Wint GRW, Conchedda G, Van Boeckel TP, Ercoli V, Palamara E, Cinardi G, DâAietti L, Hay SI, and Gilbert M. (2014) Mapping the Global Distribution of Livestock. PLoS ONE 9(5): e96084. doi:10.1371/journal.pone.0096084 The supplementary information includes a list of the observed data used to train this version of the pigs model.
-
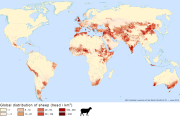
This data-set shows the most recent global model of the sheep distribution. It is the first update (version 2.01) of the recently published Gridded Livestock of the World (GLW) 2.0 (May 2014). More information and access to the data of the GLW version 2.0 are in the dedicated web-site: http://livestock.geo-wiki.org/ The GLW 2007 remains available for download in FAO Geonetwork. However, a quantitative assessment of change is not possible between the GLW 2007 and the GLW 2.0 (and its updates) due to different modeling techniques, spatial resolution, predicting variables and training data. The bibliographic reference to the GLW 2.0 and its updates is: Robinson TP, Wint GRW, Conchedda G, Van Boeckel TP, Ercoli V, Palamara E, Cinardi G, DâAietti L, Hay SI, and Gilbert M. (2014) Mapping the Global Distribution of Livestock. PLoS ONE 9(5): e96084. doi:10.1371/journal.pone.0096084 The supplementary information includes a list of the observed data used to train this version of the sheep model.
-
This data-set shows the most recent global model of the ducks distribution. It is the first update (version 2.01) of the recently published Gridded Livestock of the World (GLW) 2.0 (May 2014). More information and access to the data of GLW version 2.0 are in the dedicated application: http://livestock.geo-wiki.org/ The GLW 2007 remains available for download in FAO Geonetwork. However, the user is advised that a quantitative assessment of change is not possible between the GLW 2007 and the GLW 2.0 (and its updates) due to different modeling techniques, spatial resolution, predicting variables and training data. GLW 2.0 and its updates map separately the chickens and the ducks distributions. The bibliographic reference to the GLW 2.0 and its updates is: Robinson TP, Wint GRW, Conchedda G, Van Boeckel TP, Ercoli V, Palamara E, Cinardi G, D’Aietti L, Hay SI, and Gilbert M. (2014) Mapping the Global Distribution of Livestock. PLoS ONE 9(5): e96084. doi:10.1371/journal.pone.0096084
-
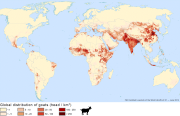
This data-set shows the most recent global model of the goats distribution. It is the first update (version 2.01) of the recently published Gridded Livestock of the World (GLW) 2.0 (May 2014). More information and access to the data of the GLW version 2.0 are in the dedicated web-site: http://livestock.geo-wiki.org/ The GLW 2007 remains available for download in FAO Geonetwork. However, a quantitative assessment of change is not possible between the GLW 2007 and the GLW 2.0 (and its updates) due to different modeling techniques, spatial resolution, predicting variables and training data. The bibliographic reference to the GLW 2.0 and its updates is: Robinson TP, Wint GRW, Conchedda G, Van Boeckel TP, Ercoli V, Palamara E, Cinardi G, DâAietti L, Hay SI, and Gilbert M. (2014) Mapping the Global Distribution of Livestock. PLoS ONE 9(5): e96084. doi:10.1371/journal.pone.0096084 The supplementary information includes a list of the observed data used to train this version of the goats model.
-
Source: Environment, Forest and Climate Change (EFCC) and Country Investment Plan (CIP) The EFCC-CIP responds to the urgent need to address environmental degradation and to improve the country’s ability to meet the threats posed by climate change.
-

This dataset displays the countries that have made used of the Open Foris tools for the national forest monitoring. Open Foris is a free open-source software launched by FAO for environmental monitoring. It consists of a set of tools which facilitate flexible and efficient data collection, analysis and reporting and developed in collaboration with countries. These tools can be used for a wide range of monitoring purposes such as forest inventories, climate change reporting, socio-economic surveys, biodiversity assessment, land use and forestry measurement and deforestation monitoring with remote sensing. Bangladesh, among other countries, took advantage from the use of the Open Foris platform for the creation of critical information on forest and land, enhancing the country’s efforts to mitigate and adapt to climate change and contributing to investment plans.
-
Climate Hazards Group InfraRed Precipitation with Station data (CHIRPS) is a 30+ year quasi-global rainfall dataset. CHIRPS incorporates 0.05° resolution satellite imagery with in-situ station data to create gridded rainfall time series for trend analysis and seasonal drought monitoring. Approximately 5km (0.05°) unit: "mm" dataType: "Float32" noDataValue: -9999