 FAO Map Catalog
yield anomaly
Type of resources
Available actions
Topics
Keywords
Contact for the resource
Provided by
Years
Formats
Representation types
Update frequencies
status
Resolution
-
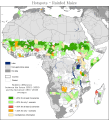
The hotspots zones of all the rainfed crops have been combined with the suitability classes as follow. The number of crops with a yield increase or decrease of more than 10 and 20% has been computed considering two suitability thresholds: one above 0% and another one above 40%. The results have been mapped showing the areas with positive impact in green and the areas with a negative impact in red. One map has been produced considering at least one scenario showing the same trend and the other one considering at least two scenarios showing the same trend. This data set has been produced in the framework of the “Climate change predictions in Sub-Saharan Africa: impacts and adaptations (ClimAfrica)” project, Work Package 4 (WP4). More information on ClimAfrica project is provided in the Supplemental Information section of this metadata.
-
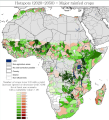
Hotspots zones have been identified for each agro-climatic and climatic parameter and future period, based on the yield anomaly classes (relative differences between the future and the historical period). For each crop and each period, the hotspots are represented by 5 classes: - Zones with a high decrease (>20%) for at least one scenario - Zones with a high decrease (>20%) for at least two scenarios - Zones with a high increase (>20%) for at least one scenario - Zones with a high increase (>20%) for at least two scenarios - Zones with a contradictory information between models This data set has been produced in the framework of the “Climate change predictions in Sub-Saharan Africa: impacts and adaptations (ClimAfrica)” project, Work Package 4 (WP4). More information on ClimAfrica project is provided in the Supplemental Information section of this metadata..