 FAO Map Catalog
vegetation continuity
Type of resources
Available actions
Topics
Keywords
Contact for the resource
Provided by
Years
Representation types
Update frequencies
status
Resolution
-
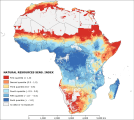
The “natural resources sensitivity” symbolizes the ecosystem vitality and degree of conservation in 2010. Deforestation and loss of water resources quality may render certain areas more sensitive to climate stressors on account of the loss of normal vegetation cover, the depletion of biodiversity, the reduction in ecosystem services and significant loss of beneficial assets. The index results from the first cluster of the Principal Component Analysis preformed among 16 potential variables. The analysis identify five dominant variables, namely “water availability per capita”, “net primary production”, “forest accessibility”, “vegetation continuity” and “climatic resources availability”, assigning respectively the weights of 0.19, 0.21, 0.165, 0.21 and 0.225. Before to perform the analysis the variables “water availability per capita”, “forest accessibility” and “vegetation continuity” were log transformed to shorten the extreme variation and then together with the other two variables were score-standardized (converted to distribution with average of 0 and standard deviation of 1; all variables with inverse method) in order to be comparable. The 6 arc-minute grid “water availability per capita” of 2005 was computed by sum of the run-off and discharge grids produced by World Water Development Report II and then sampled at 0.5 arc-minutes. A focal statistic ran with a radius of 55 cells (about 50 Km). This had a smoothing effect and represents some of the extend influence of major rivers as a resources for local people. To calculate the available water per capita it was then divided by the population. The 5 arc-minute grid “net primary production” of 2000 was gathered from FAO GeoNetwork and sampled at 0.5 arc-minute. Also in this case a focal statistic ran with a radius of 22 cells (about 20 Km) in order to represents the extend effect of primary production as natural resources for local people. The 0.5 arc-minute grid “forest accessibility” was build using the grid of travel distance in minutes to large cities (which one with population greater than 50,000 people), produced by the European Commission and the World Bank to represent the connectivity in 2000, and the grid of forest occurrence, extracted from the FAO Global Land Cover-SHARE dataset of 2014. The result measures the distance in minutes between forest and cities, thus is a proxy for remoteness and naturalness of forest. The 0.125 arc-minute grid “vegetation continuity” of 2010 were collected from University of Maryland and NASA and sampled at 0.5 arc-minute. A focal statistic ran with a radius of 55 cells (about 50 Km). This had a smoothing effect and represents some of the extend influence of vegetation concentration as a resources for local people. Finally the 0.5 arc-minute grid “climatic resources availability” was produced within the ClimAfrica project. The “water availability per capita” represents the potential water available per people in a certain area. We can consider the area with small values more sensitive to climatic stress, because lack a buffer of water resources, precious in a prevalently rain-fed agricultural system like in Africa. The “net primary production” and the “vegetation continuity” are proxies of the potential vegetal productivity available in a certain area. Moreover “vegetation continuity” is an indicator of abundance of natural ecosystem services that can reduce the sensitivity of human-environment systems. The “forest accessibility” assessing the distance between human and natural system measure the anthropogenic degree of a forest. A forest recording a high anthropogenic degree (thus near in terms of minute from a city) may potentially be threaded by human activity and thus represent a fragile ecosystem. Finally the “climatic resources availability” is an indicator of the climatic potential for biomass production. It is based on the climatically determined biomass productivity index that is a proxy for the atmospheric energy available for biomass production, as expressed by accumulated temperature, adjusted for drought stress. This dataset has been produced in the framework of the “Climate change predictions in Sub-Saharan Africa: impacts and adaptations (ClimAfrica)” project, Work Package 4 (WP4). More information on ClimAfrica project is provided in the Supplemental Information section of this metadata.