 FAO Map Catalog
social development
Type of resources
Available actions
Topics
Keywords
Contact for the resource
Provided by
Formats
Representation types
Update frequencies
status
Scale
-
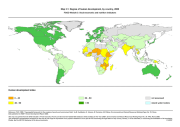
The FGGD degree of human development map is a global vector datalayer at scale 1:5 000 000. The map depicts national statistical data and highlights differences among countries with respect to the human development index for the year 2000. Data are from UNDP, 2002, Human Development Report.
-
The FGGD poverty map is a global vector datalayer at scale 1:5 000 000. The map depicts the differences among countries with respect to the national population estimated to be living in poverty as of the latest year for which data was available in 2005. Data have been compiled by FAO from data reported in World Bank, WDI Online, as of April 2005.
-
The FGGD extreme poverty map is a global vector datalayer at scale 1:5 000 000. The map depicts the differences among countries with respect to the national population estimated to be living in extreme poverty as of the latest year for which data was available in 2005. Data have been compiled by FAO from data reported in World Bank, WDI Online, as of April 2005.
-
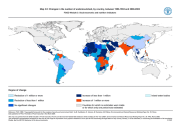
The FGGD changes in undernourishment map is a global vector datalayer at scale 1:5 000 000. The map depicts the differences among countries with respect to the difference between the share of the population estimated to be undernourished in 1990-1992 and in 2000-2002, as reported in the FAO publication The State of Food Insecurity (SOFI) in the World 2004. The method used by FAO to estimate the number of undernourished by country is described in FAOSTAT.
-
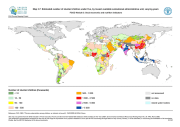
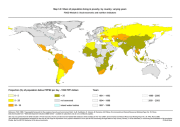
The FGGD estimated number of stunted children map is a global raster datalayer with a resolution of 5 arc-minutes. The number of stunted children is estimated according to the lowest available sub-national administrative units: all pixels within the unit boundaries will have the same value, that means the estimated number of stunted children in the unit. Data have been compiled by FAO using three main information: the prevalence of stunting, LandScan global population database and the percentage of children under five. This last information is at national level and its source is UNICEF.
-
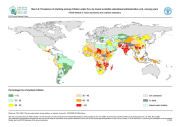
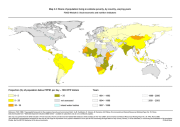
The FGGD prevalence of stunting map is a global raster datalayer with a resolution of 5 arc-minutes. The percentage of stunted children undev five year old is reported according to the lowest available sub-national administrative units: all pixels within the unit boundaries will have the same value. Data have been compiled by FAO from different sources: Demographic and Health Surveys (DHS), UNICEF MICS, WHO Global Database on Child Growth and Malnutrition, and national surveys.
-
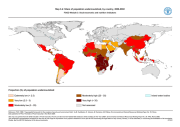
The FGGD prevalence of undernourishment map is a global vector datalayer at scale 1:5 000 000. The map depicts the differences among countries with respect to the share of the national population estimated to be undernourished in 2000-2002, as reported in the FAO publication The State of Food Insecurity (SOFI) in the World 2004. The method used by FAO to estimate the number of undernourished by country is described in FAOSTAT.