 FAO Map Catalog
night light infrastructure index
Type of resources
Available actions
Topics
Keywords
Contact for the resource
Provided by
Years
Representation types
Update frequencies
status
Resolution
-
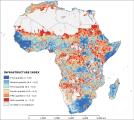
The “infrastructure index” describes the degree of development of physical facilities and networks in a certain area in 2010. The quality of infrastructure is an important measure of the relative adaptive capacity of a region. Regions with developed infrastructure systems are presumed to be better able to adapt to climatic stresses. Improved infrastructure may reduce transactions costs, and strengthen the links between labor and product markets. Moreover, improved infrastructure should encourage the formation of non-farm enterprises as a source of diversification in the short run and, eventually, a transition out of agriculture. The index results from the second cluster of the Principal Component Analysis preformed among 10 potential variables. The analysis identifies three dominant variables, namely “road density”, “road availability” and “infrastructure poverty”, assigning weights of 0.47, 0.36 and 0.17, respectively. Before to perform the analysis all variables were log transformed to shorten the extreme variation and then were score-standardized (converted to distribution with average of 0 and standard deviation of 1) in order to be comparable. A shapefile of road network was published by the Center for International Earth Science Information Network of Columbia University in 2013. The “road density” was computed by calculating the Kilometers of road per cell (size 0.5 arc-minute) and then running a focal statistic (radius of about 30 km to spread the effect of a transportation network in a neighborhood). The “road availability” is the road density divided by the logarithm of population. The 0.5 arc-minute grid “infrastructure poverty” is based on the average lights per pixel in 2010, which was produced by NOAA National Geophysical Data Center, divided by the logarithm of population. The original data was highly fragmented and at fine resolution may have contained fine-scale artifacts at urban edges due to data mismatch between the population and night-lights datasets. Thus focal statistics ran within 20 Km to calculate an average values and represents some of the extend influence of the infrastructure network for local people. The density and availability of road is a normally accepted indicator of infrastructure development degree. Moreover, developed road network facilitate the diffusion of rural products to large markets enhancing the income of rural population and sharing the risk of crisis among larger area. The average night light density per capita represents the diffusion of electricity among population and here is considered a proxy of diffusion of developed infrastructural network. This dataset has been produced in the framework of the “Climate change predictions in Sub-Saharan Africa: impacts and adaptations (ClimAfrica)” project, Work Package 4 (WP4). More information on ClimAfrica project is provided in the Supplemental Information section of this metadata.