 FAO Map Catalog
livestock
Type of resources
Available actions
Topics
Keywords
Contact for the resource
Provided by
Years
Formats
Representation types
Update frequencies
status
Scale
-
**Table content** - Year - Indicator - species - Value - Um - Flag **Value assigned to No-data**:The Director, Statistics, Research and Information Directorate (SRID)-MoFA. P.O. Box M37, Accra TEL:
-
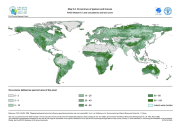
The FGGD land cover occurrence maps are global raster datalayers with a resolution of 5 arc-minutes. Each pixel in each map contains a value representing the percentage of the area belonging to the land cover type concerned. The method is described in FAO and IIASA, 2007, Mapping biophysical factors that influence agricultural production and rural vulnerability, by H. von Velthuizen et al.
-
-

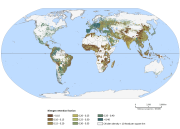
Map of total dairy cattle milk production. Total milk production in kg of milk in 2013. Ethiopia produces approximately 3.8 million litres of milk from 12 million milking cows – an average of 1.7 litres per cow per day over an average lactation period of 180 days. In terms of production system contribution to milk production, the rural mixed crop-livestock dairy system produces the largest share of milk, contributing 72% of the total milk supply from 65% of the milking animals. Pastoral and agro-pastoral systems and the market-oriented systems contribute 24% and 4% of the total milk, respectively, with 34% and 1% of the milking cows, respectively. Source: FAO & New Zealand Agricultural Greenhouse Gas Research Centre. 2017. Supporting low emissions development in the Ethiopian dairy cattle sector – reducing enteric methane for food security and livelihoods. Rome. 34 pp. In this map, the Global Livestock Environmental Assessment Model (GLEAM; http://www.fao.org/gleam/en/) is the main analytical tool used to assess the emissions for the baseline year (2013). The spatially explicit GLEAM framework allows the incorporation of heterogeneity in emissions, emission reductions and production responses. The model was further developed to meet the needs of this study for Ethiopia. The dairy production systems in GLEAM were further refined to reflect the specificities of the dairy cattle production systems in Ethiopia and the database of production systems parameters was updated with more recent and system specific information and data on factors such as animal populations, performance parameters, feeding systems and manure management, taken from national databases.
-

Based on bovine and human population densities (FAO, 1999), livestock systems distribution, system-specific production parameters, calculations of output per animal to obtain milk offtake per capita were performed using the Livestock Development Planning System Version 2 model. Part of a study "Cattle and small ruminant production systems in sub-Saharan Africa: a systematic review" (FAO, 2002).
-
This data set represents the percentage of total nitrogen present in the feed ration which is retained in the products (meat and eggs in this case). A raster layer containing the surface area of each cell within the thematic map is also available for download as ancillary dataset. Source: GLEAM
-
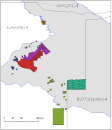
This layer represents the spatial distribution of Government Farms, as of 2005, in Namibia, that share geographical overlapping with the Okavango Basin. Source: Ministry of Agriculture, Water and Forestry of Namibia. This dataset is part of the GIS Database for the Environment Protection and Sustainable Management of the Okavango River Basin project (EPSMO). Detailed information on the GIS Database can be found in the “GIS Database for the EPSMO Project†document produced by Luis Veríssimo (FAO consultant) in July 2009, and here available for download.
-
This data set represents the average feed digestibility (or net energy content) expressed as percentage of the total ration for dairy and non-dairy cattle herds across different production systems. A raster layer containing the surface area of each cell within the thematic map is also available for download as ancillary dataset. Source: GLEAM
-

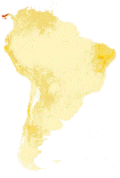
Based on bovine density (FAO, 1999), livestock systems distribution, system-specific production parameters, calculations of output per animal to obtain beef production density (output per km2) were performed using the Livestock Development Planning System Version 2 model. Part of a study "Cattle and small ruminant production systems in sub-Saharan Africa: a systematic review" (FAO, 2002).
-
This data set represents the percentage of total nitrogen present in the feed ration which is retained in the products (meat in this case). A raster layer containing the surface area of each cell within the thematic map is also available for download as ancillary dataset. Source: GLEAM