 FAO Map Catalog
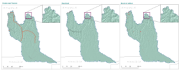
infrastructure
Type of resources
Available actions
Topics
Keywords
Contact for the resource
Provided by
Years
Formats
Representation types
Update frequencies
status
Scale
Resolution
-
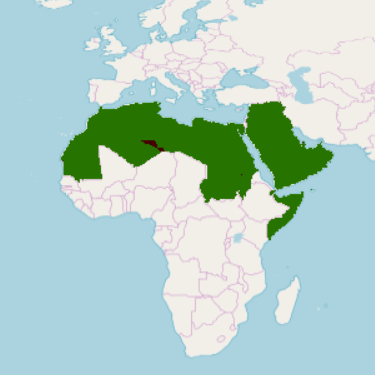
Part of the Integrated Vulnerability Assessment in the Arab Region, this 1km pixel resolution raster dataset provides a representation of Sensitivity to climate change impact for the Manmade dimension indicator – Road Network - in the Middle East and North Africa Region. Vulnerability is a concept used to express the complex interaction of climate change effects and the susceptibility of a system to its impacts. The integrated vulnerability assessment methodology is based on an understanding of vulnerability as a function of a system’s climate change exposure, sensitivity and adaptive capacity to cope with climate change effects, consistent with the approach put forward by the Intergovernmental Panel on Climate Change (IPCC) in its Fourth Assessment Report (AR4). Within this conceptual framework, Sensitivity provides information about the status quo of the physical and natural environment that makes the affected systems particularly susceptible to climate change. Sensitivity indicators were clustered into three dimensions: population, natural, and manmade. Within the vulnerability assessment methodology, it is assumed the indicators retain the same values for reference period and future periods. A class value of 1 was assigned to represent a favorable condition (low sensitivity) while a class value of 10 designates an unfavorable condition.
-
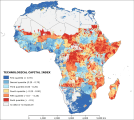
The “technological capital index” symbolizes the physical means that determine the potential adaptive capacity degree of a particular unit of analysis in 2010. It is linked with the diffusion of basic life technology and infrastructure (e.g. transportation network). It is the combination of two underlying indexes: the “household technology index” and the “infrastructure index”. These original indexes correspond to the two principal components recognized by Principal Component Analysis among 10 potential variables. The analysis assigned relative weights to the “household technology index” and the “infrastructure index”, that are 0.62 and 0.38, respectively. This dataset has been produced in the framework of the “Climate change predictions in Sub-Saharan Africa: impacts and adaptations (ClimAfrica)” project, Work Package 4 (WP4). More information on ClimAfrica project is provided in the Supplemental Information section of this metadata.
-
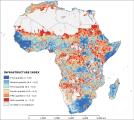
The “infrastructure index” describes the degree of development of physical facilities and networks in a certain area in 2010. The quality of infrastructure is an important measure of the relative adaptive capacity of a region. Regions with developed infrastructure systems are presumed to be better able to adapt to climatic stresses. Improved infrastructure may reduce transactions costs, and strengthen the links between labor and product markets. Moreover, improved infrastructure should encourage the formation of non-farm enterprises as a source of diversification in the short run and, eventually, a transition out of agriculture. The index results from the second cluster of the Principal Component Analysis preformed among 10 potential variables. The analysis identifies three dominant variables, namely “road density”, “road availability” and “infrastructure poverty”, assigning weights of 0.47, 0.36 and 0.17, respectively. Before to perform the analysis all variables were log transformed to shorten the extreme variation and then were score-standardized (converted to distribution with average of 0 and standard deviation of 1) in order to be comparable. A shapefile of road network was published by the Center for International Earth Science Information Network of Columbia University in 2013. The “road density” was computed by calculating the Kilometers of road per cell (size 0.5 arc-minute) and then running a focal statistic (radius of about 30 km to spread the effect of a transportation network in a neighborhood). The “road availability” is the road density divided by the logarithm of population. The 0.5 arc-minute grid “infrastructure poverty” is based on the average lights per pixel in 2010, which was produced by NOAA National Geophysical Data Center, divided by the logarithm of population. The original data was highly fragmented and at fine resolution may have contained fine-scale artifacts at urban edges due to data mismatch between the population and night-lights datasets. Thus focal statistics ran within 20 Km to calculate an average values and represents some of the extend influence of the infrastructure network for local people. The density and availability of road is a normally accepted indicator of infrastructure development degree. Moreover, developed road network facilitate the diffusion of rural products to large markets enhancing the income of rural population and sharing the risk of crisis among larger area. The average night light density per capita represents the diffusion of electricity among population and here is considered a proxy of diffusion of developed infrastructural network. This dataset has been produced in the framework of the “Climate change predictions in Sub-Saharan Africa: impacts and adaptations (ClimAfrica)” project, Work Package 4 (WP4). More information on ClimAfrica project is provided in the Supplemental Information section of this metadata.
-
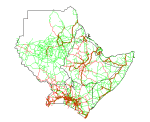
Roads in Djibouti, Eritrea, Ethiopia, Kenya, Somalia, Sudan and Uganda.
-
Infrastructures including vector layers that represent the network of roads, gravel roads, thacks, railroad lines and build-up areas in the CORB-contributing area of Angola. Source: Data provided by SINFIC, based on the Topographic Map of Angola (IGCA). This dataset is part of the GIS Database for the Environment Protection and Sustainable Management of the Okavango River Basin project (EPSMO). Detailed information on the database can be found in the “GIS Database for the EPSMO Project†document produced by Luis Veríssimo (FAO consultant) in July 2009, and here available for download.