 FAO Map Catalog
health
Type of resources
Available actions
Topics
Keywords
Contact for the resource
Provided by
Years
Formats
Representation types
Update frequencies
status
Scale
Resolution
-

The INFORM Epidemic Risk Index is a prototype version of hazard dependent INFORM Risk Index created in 2018. It was developed under the technical lead of the JRC and in close collaboration with WHO for the epidemic components. Through extensive consultation, the WHO identified the underlying risk drivers of epidemic, which enabled the development of a conceptual framework for epidemic risk assessment in countries. JRC developed the INFORM Epidemic Risk Index as an adaptation of the INFORM Risk index, preserving the integrity of the original model. The risk score ranges from 0-10, where 10 is the highest risk. In its original version it is covering four groups of Infectious diseases on the base of the mode of transmission and the epidemiological triad addressing agent, host and environment: Zoonoses, Vector borne, Person-to-person (P2P), Foodborne and Waterborne
-
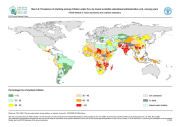
The FGGD prevalence of stunting map is a global raster datalayer with a resolution of 5 arc-minutes. The percentage of stunted children undev five year old is reported according to the lowest available sub-national administrative units: all pixels within the unit boundaries will have the same value. Data have been compiled by FAO from different sources: Demographic and Health Surveys (DHS), UNICEF MICS, WHO Global Database on Child Growth and Malnutrition, and national surveys.
-
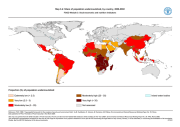
The FGGD prevalence of undernourishment map is a global vector datalayer at scale 1:5 000 000. The map depicts the differences among countries with respect to the share of the national population estimated to be undernourished in 2000-2002, as reported in the FAO publication The State of Food Insecurity (SOFI) in the World 2004. The method used by FAO to estimate the number of undernourished by country is described in FAOSTAT.
-
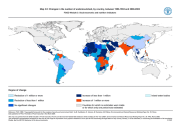
The FGGD changes in undernourishment map is a global vector datalayer at scale 1:5 000 000. The map depicts the differences among countries with respect to the difference between the share of the population estimated to be undernourished in 1990-1992 and in 2000-2002, as reported in the FAO publication The State of Food Insecurity (SOFI) in the World 2004. The method used by FAO to estimate the number of undernourished by country is described in FAOSTAT.
-
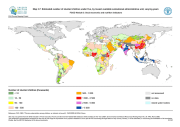
The FGGD estimated number of stunted children map is a global raster datalayer with a resolution of 5 arc-minutes. The number of stunted children is estimated according to the lowest available sub-national administrative units: all pixels within the unit boundaries will have the same value, that means the estimated number of stunted children in the unit. Data have been compiled by FAO using three main information: the prevalence of stunting, LandScan global population database and the percentage of children under five. This last information is at national level and its source is UNICEF.
-
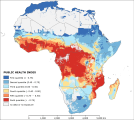
The “public health index” describes the general health status of a certain area in 2010. The degree of health status is an important factor of adaptive capacity because the epidemics deepens poverty, reverses human development achievements, worsens gender inequalities, erodes the ability of governments to maintain essential services, reduces labor productivity and supply, and puts a brake on economic growth. The index results from the first cluster of the Principal Component Analysis preformed among 16 potential variables. The analysis identify four dominant variables, namely “TBC incidence”, “Plasmodium entomological inoculation rate”, “Plasmodium endemic rate” and “Tsetse fly potential habitat”, assigning respectively the weights of 0.2, 0.28, 0.26 and 0.26. Before to perform the analysis all the variables were log transformed to shorten the extreme variation and then were score-standardized (converted to distribution with average of 0 and standard deviation of 1; all variables with inverse method) in order to be comparable. Country-based data of TBC incidence were collected from World Bank. In particular the average of the period 2008-2012 was computed. Tabular data were linked by country to the national boundaries shapefile (FAO/GAUL) and then converted into raster format (resolution 0.5 arc-minute). The 0.5 arc-minute grids on “Plasmodium entomological inoculation rate” and “Plasmodium endemic rate”, produced by Malaria Atlas Project of Oxford University, measure the intensity of malaria transmission in 2010. The first is the number of P. falciparum infective bites received by an individual annually, while the second mapped the age-standardized P. falciparum Parasite Rate which describes the estimated proportion of 2-10 year olds in the general population that are infected with P. falciparum at any one time, averaged over the 12 months of 2010. The 3 arc-minute grid “Tsetse fly potential habitat” were gathered from the three fly groups for 1999 from FAO geonetwork and then was sampled at 0.5 arc-minute. TBC, Tsetse and malaria are important diseases in Africa and thus are main thread to adaptive capacity enhancement in Africa. Areas with large diffusion of such epidemic diseases have weak resilience degree and low capacity to implement climate change adaptation actions. This dataset has been produced in the framework of the “Climate change predictions in Sub-Saharan Africa: impacts and adaptations (ClimAfrica)” project, Work Package 4 (WP4). More information on ClimAfrica project is provided in the Supplemental Information section of this metadata.
-
The FGGD Digital Atlas consists of more than 100 global maps that allows to analyse food insecurity and poverty in relation to environment. It is subdivided into 6 modules as follows: Module 1 Boundaries and Topography Module 2 Population Module 3 Socio-Economic and Nutrition Indicators Module 4 Environmental Conditions Module 5 Land Use Patterns and Land Cover Module 6 Land Productivity Potential