 FAO Map Catalog
cereals
Type of resources
Available actions
Topics
Keywords
Contact for the resource
Provided by
Years
Formats
Representation types
Update frequencies
status
Scale
-
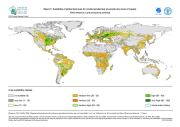
The FGGD crop suitability maps at low, intermediate and high levels of inputs under rainfed conditions on global land area are global raster datalayers with a resolution of 5 arc-minutes. Each pixel contains the 2005 version of the suitability index for rainfed production of the crop or crop group concerned. The method and crop coverage of each crop group are described in FAO and IIASA, 2007, Mapping biophysical factors that influence agricultural production and rural vulnerability, by H. von Velthuizen et al.
-
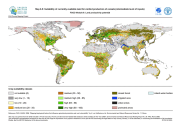
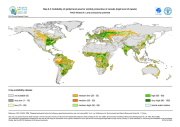
The FGGD crop suitability maps at low, intermediate and high levels of inputs under rainfed conditions on currently available land are global raster datalayers with a resolution of 5 arc-minutes. Pixels classified as urban, closed forest or irrigated contain values of zero. Each remaining pixel contains the 2005 version of the suitability index for rainfed production of the crop or crop group concerned. The method and crop coverage of each crop group are described in FAO and IIASA, 2007, Mapping biophysical factors that influence agricultural production and rural vulnerability, by H. von Velthuizen et al.
-
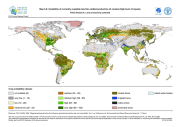
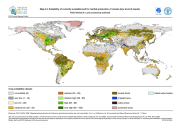
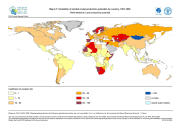
The FGGD production potential variability map is a global vector datalayer at scale 1:5 000 000. The map depicts the average coefficient of variation for cereal production potential under rainfed conditions for the period 1961 to 1990 by country. The method is described in FAO and IIASA, 2007, Mapping biophysical factors that influence agricultural production and rural vulnerability, by H. von Velthuizen et al.
-
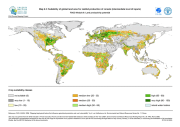
The FGGD crop suitability maps at low, intermediate and high levels of inputs under rainfed conditions on global land area are global raster datalayers with a resolution of 5 arc-minutes. Each pixel contains the 2005 version of the suitability index for rainfed production of the crop or crop group concerned. The method and crop coverage of each crop group are described in FAO and IIASA, 2007, Mapping biophysical factors that influence agricultural production and rural vulnerability, by H. von Velthuizen et al.
-
The Food and Agriculture Organization of the United Nations (FAO) with the collaboration of the International Institute for Applied Systems Analysis (IIASA), has developed a system that enables rational land-use planning on the basis of an inventory of land resources and evaluation of biophysical limitations and potentials. This is referred to as the Agro-ecological Zones (AEZ) methodology.