 FAO Map Catalog
Keyword
cattle
Type of resources
Available actions
Topics
Keywords
Contact for the resource
Provided by
Update frequencies
status
From
1
-
2
/
2
-
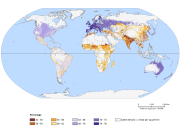
This data set represents the average feed digestibility (or net energy content) expressed as percentage of the total ration for dairy and non-dairy cattle herds across different production systems. A raster layer containing the surface area of each cell within the thematic map is also available for download as ancillary dataset. Source: GLEAM
-
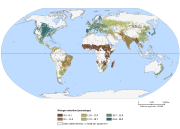
This data set represents the percentage of total nitrogen present in the feed ration which is retained in the products (milk in this case). A raster layer containing the surface area of each cell within the thematic map is also available for download as ancillary dataset. Source: GLEAM