 FAO Map Catalog
World
Type of resources
Available actions
Topics
Keywords
Contact for the resource
Provided by
Years
Formats
Representation types
Update frequencies
status
Scale
Resolution
-

The Climate Change ATLAS (CSIC, https://github.com/SantanderMetGroup/ATLAS) provides climate change information for essential climate variables generated from CMIP and CORDEX international initiatives. There are different data cubes for experiment and variable providing climate projections for 1) three reference future periods (2021-2040, 2041-2060, 2080-2100) for RCP 2.6 an 8.5 scenarios with respect to the baseline reference period 1981-2010, and 2) three Global Warming Levels (1.5, 2 and 3 degC, obtained from the RCP8.5 scenario), with respect to preindustrial values (as characterized by the 1850-1900 period). The list of experiments and models used is available at https://github.com/SantanderMetGroup/ATLAS/tree/master/AtlasHub-inventory
-
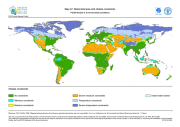
The FGGD climate constraints map is a global raster datalayer with a resolution of 5 arc-minutes. Each pixel contains a class value for the degree to which climate constrains agricultural production potential in the pixel area. The data are from FAO and IIASA, 2000, Global agro-ecological zones, as reported in FAO and IIASA, 2007, Mapping biophysical factors that influence agricultural production and rural vulnerability, by H. von Velthuizen et al.
-

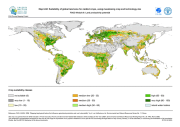
The FGGD crop suitability maps at low, intermediate and high levels of inputs under rainfed conditions on global land area are global raster datalayers with a resolution of 5 arc-minutes. Each pixel contains the 2005 version of the suitability index for rainfed production of the crop or crop group concerned. The method and crop coverage of each crop group are described in FAO and IIASA, 2007, Mapping biophysical factors that influence agricultural production and rural vulnerability, by H. von Velthuizen et al.
-

The FGGD crop suitability maps at low, intermediate and high levels of inputs under rainfed conditions on currently available land are global raster datalayers with a resolution of 5 arc-minutes. Pixels classified as urban, closed forest or irrigated contain values of zero. Each remaining pixel contains the 2005 version of the suitability index for rainfed production of the crop or crop group concerned. The method and crop coverage of each crop group are described in FAO and IIASA, 2007, Mapping biophysical factors that influence agricultural production and rural vulnerability, by H. von Velthuizen et al.
-

The FGGD pasture suitability map on currently available land is a global raster datalayer with a resolution of 5 arc-minutes. Pixels classified as urban, closed forest or irrigated contain negative values. Each remaining pixel contains the suitability index for pasture, 2005 version. The method is described in FAO and IIASA, 2007, Mapping biophysical factors that influence agricultural production and rural vulnerability, by H. von Velthuizen et al.
-
The FGGD suitability map using maximising crop and technology mix is a global raster datalayer with a resolution of 5 arc-minutes. Each pixel contains the suitability index for rainfed crops, using maximising crop and technology mix, 2005 version. The method is described in FAO and IIASA, 2007, Mapping biophysical factors that influence agricultural production and rural vulnerability, by H. von Velthuizen et al.
-
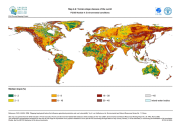
The FGGD terrain slope map is a global raster datalayer with a resolution of 5 arc-minutes. Each pixel contains a terrain slope class value for the pixel area. The data are from U.S. Geological Survey, 1993, GTOPO 30, as reported in FAO and IIASA, 2000, Global agro-ecological zones, and FAO and IIASA, 2007, Mapping biophysical factors that influence agricultural production and rural vulnerability, by H. von Velthuizen et al.
-

The FGGD crop suitability maps at low, intermediate and high levels of inputs under rainfed conditions on global land area are global raster datalayers with a resolution of 5 arc-minutes. Each pixel contains the 2005 version of the suitability index for rainfed production of the crop or crop group concerned. The method and crop coverage of each crop group are described in FAO and IIASA, 2007, Mapping biophysical factors that influence agricultural production and rural vulnerability, by H. von Velthuizen et al.
-

The FGGD multiple cropping zone map under rainfed conditions on global land area is a global raster datalayer with a resolution of 5 arc-minutes. Each pixel contains the 2005 version of the suitability index for multiple cropping on the land area of the pixel. The method is described in FAO and IIASA, 2007, Mapping biophysical factors that influence agricultural production and rural vulnerability, by H. von Velthuizen et al.
-
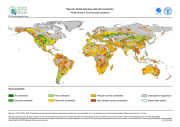
The FGGD soil constraints map is a global raster datalayer with a resolution of 5 arc-minutes. Each pixel contains a class value for the degree to which soil characteristics constrain agricultural production potential in the pixel area. The data are from FAO and IIASA, 2000, Global agro-ecological zones, as reported in FAO and IIASA, 2007, Mapping biophysical factors that influence agricultural production and rural vulnerability, by H. von Velthuizen et al.