 FAO Map Catalog
South Sudan
Type of resources
Available actions
Topics
Keywords
Contact for the resource
Provided by
Years
Formats
Representation types
Update frequencies
status
Resolution
-
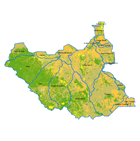
This dataset divides the South Sudan according to its hydrological characteristics: major hydrological basins and their sub-basins It identifies eighteen sub-basins as follows: Akoba, Bahr al arab, Buhayrat abyad, Gelha, Khawr biban, Khawr tunbak, Khawr_marchar, Kidepo, Kwahr as sidrah, Kwahr mâ boloko, Lake turkana, Lotagipi swamp, Sopo, Sue, White nile 3, White nile 4, White nile 5 and White nile 6. The dataset provides information on: numerical code and name of the major basin (MAJ_BAS and MAJ_NAME); - area of the major basin in square km (MAJ_AREA); and numerical code and name of the sub-basin (SUB_BAS and SUB_NAME). The dataset comes from the HydroSHEDS (Hydrological data and maps based on SHuttle Elevation Derivatives at multiple Scales) of the US Geological Survey. The USGS HydroSHEDS is based on high-resolution elevation data obtained during a Space Shuttle flight of NASAâs Shuttle Radar Topography Mission (SRTM). Around twenty-three sub-basins fall in the South Sudan area, including five sub-basins of which only a small portion is comprised. They are part of two main hydrological basins: the biggest part of the study area belongs to the Nile basin, while the eastern part of the area belongs to the Rift Valley basin. The delineation of the hydrological basins can be considered as the starting point in the analysis of the hydrological cycle to study surface water resources systems.
-
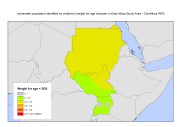
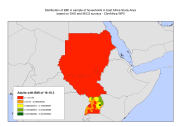
Vulnerable population identified by the nutritional status of children (weight for age and weight for height) as indicators for food security, in sample of households in East Africa study area. Data based on DHS and MICS surveys. In defining vulnerability, WFP (2009) and IFPRI (2012) have been followed and combined with indicators for food security with health indicators that signal vulnerability in a physical sense. IFPRI's Global Hunger Index uses three indicators to measure hunger: the number of adults being undernourished, the number of children that have low weight for age, and child mortality. Other classifications of food security use the variety of the diet as an indicator, combined with anthropometric data on children. However, in the DHS data there were no information available on child mortality, nor on dietary composition. Given these data limitations, data on nutritional status of women (Body Mass Index, BMI) for women and children (weight for age and weight for height) have been used as indicators for food security. These data were combined with data on morbidity among adults and children, specifically the occurrence of malaria, cough, and diarrhea. Combinations of indicators have led to a classification of households as being very vulnerable, vulnerable, nearly vulnerable and not vulnerable. This data set was produced in the framework of the "Climate change predictions in Sub-Saharan Africa: impacts and adaptations (ClimAfrica)" project, Work Package 5 (WP5). More information on ClimAfrica project is provided in the Supplemental Information section of this metadata. This study in WP5 aimed to identify, locate and characterize groups that are vulnerable for climate change conditions in two country clusters; one in West Africa (Benin, Burkina Faso, Côte d'Ivoire, Ghana, and Togo) and one in East Africa (Sudan, South Sudan and Uganda). Data used for the study include the Demographic and Health Surveys (DHS) , the Multi Indicator Cluster Survey (MICS) and the Afrobarometer surveys for the socio-economic variables and grid level data on agro-ecological and climatic conditions.
-
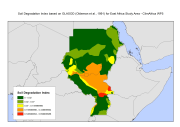
The soil degradation index is based on the Global Assessment of Human-induced Soil Degradation (GLASOD) (Oldeman et al., 1991). The UNEP-funded GLASOD project produced a world map of human-induced soil degradation. Data were compiled in cooperation with a large number of soil scientists throughout the world, using uniform guidelines and international correlation. The status of soil degradation was mapped within physiographic units, based on expert judgments, indicating the type, extent, degree, rate and main causes of the degradation process. To compare the impact of land degradation between different sites we created a land degradation index that attributes the following weights to area shares of the soil degradation classes 'light'= 1, 'moderate'=2, 'severeâ' = 3 and 'very severe' = 4. Next, we scaled the index between a range of 0-1. Combining classes and area shares in a single land degradation index is common practice in many other peer reviewed studies (e.g. Leiwen et al., 2005; McCoubrey, 1998; Pace at al., 2008; Safriel, 1999; Sonneveld and Dent, 2009), which gives us, sufficient confidence to apply the index for our analysis. This dataset has been used to complement the survey data and included in the "Climate change predictions in Sub-Saharan Africa: impacts and adaptations (ClimAfrica)" project, Work Package 5 (WP5). More information on ClimAfrica project is provided in the Supplemental Information section of this metadata. This study in WP5 aimed to identify, locate and characterize groups that are vulnerable for climate change conditions in two country clusters; one in West Africa (Benin, Burkina Faso, Côte d'Ivoire, Ghana, and Togo) and one in East Africa (Sudan, South Sudan and Uganda). Data used for the study include the Demographic and Health Surveys (DHS) , the Multi Indicator Cluster Survey (MICS) and the Afrobarometer surveys for the socio-economic variables and grid level data on agro-ecological and climatic conditions.
-
In defining vulnerability, WFP (2009) and IFPRI (2012) have been followed and combined with indicators for food security with health indicators that signal vulnerability in a physical sense. IFPRI's Global Hunger Index uses three indicators to measure hunger: the number of adults being undernourished, the number of children that have low weight for age, and child mortality. Other classifications of food security use the variety of the diet as an indicator, combined with anthropometric data on children. However, in the DHS data there were no information available on child mortality, nor on dietary composition. Given these data limitations, data on nutritional status of women (Body Mass Index, BMI) for women and children (weight for age) have been used as indicators for food security. These data were combined with data on morbidity among adults and children, specifically the occurrence of malaria, cough, and diarrhea. Combinations of indicators have led to a classification of households as being very vulnerable, vulnerable, nearly vulnerable and not vulnerable. The Afrobarometer surveys did not include data on the BMI of adults nor weights for children. Here, the reported times the household went without food in the year were used prior to the date the survey was conducted as vulnerability indicator. The study area of households vulnerability included: rural, urban and total population. This data set was produced in the framework of the "Climate change predictions in Sub-Saharan Africa: impacts and adaptations (ClimAfrica)" project, Work Package 5 (WP5). More information on ClimAfrica project is provided in the Supplemental Information section of this metadata. This study in WP5 aimed to identify, locate and characterize groups that are vulnerable for climate change conditions in two country clusters; one in West Africa (Benin, Burkina Faso, Côte d'Ivoire, Ghana, and Togo) and one in East Africa (Sudan, South Sudan and Uganda). Data used for the study include the Demographic and Health Surveys (DHS) , the Multi Indicator Cluster Survey (MICS) and the Afrobarometer surveys for the socio-economic variables and grid level data on agro-ecological and climatic conditions.
-
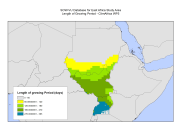
The Length of Growing Period (LGP) refers to the average duration when moisture availability allows crop growth. The calculation is based on a water balance model that compares moisture supply from precipitation, soil moisture storage and a reference evapotranspiration. The reference LGP assumes available soil moisture capacity of 100 mm per meter soil depth and a reference soil depth of one meter. LGP's were based on the baseline period of 1961-1990. This dataset has been used to complement the survey data and included in the "Climate change predictions in Sub-Saharan Africa: impacts and adaptations (ClimAfrica)" project, Work Package 5 (WP5). More information on ClimAfrica project is provided in the Supplemental Information section of this metadata. This study in WP5 aimed to identify, locate and characterize groups that are vulnerable for climate change conditions in two country clusters; one in West Africa (Benin, Burkina Faso, Côte d'Ivoire, Ghana, and Togo) and one in East Africa (Sudan, South Sudan and Uganda). Data used for the study include the Demographic and Health Surveys (DHS) , the Multi Indicator Cluster Survey (MICS) and the Afrobarometer surveys for the socio-economic variables and grid level data on agro-ecological and climatic conditions.
-
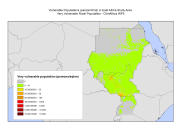
Vulnerable population identified by prevalence of diseases indicator in East Africa - ClimAfrica WP5
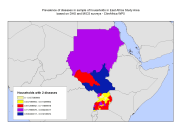
Vulnerable population identified by the prevalence of diseases (malaria, cough and diarrhea) as indicator for food security, in sample of households in East Africa study area. Data based on DHS and MICS surveys. In defining vulnerability, WFP (2009) and IFPRI (2012) have been followed and combined with indicators for food security with health indicators that signal vulnerability in a physical sense. IFPRI's Global Hunger Index uses three indicators to measure hunger: the number of adults being undernourished, the number of children that have low weight for age, and child mortality. Other classifications of food security use the variety of the diet as an indicator, combined with anthropometric data on children. However, in the DHS data there were no information available on child mortality, nor on dietary composition. Given these data limitations, data on nutritional status of women (Body Mass Index, BMI) for women and children (weight for age and weight for height) have been used as indicators for food security. These data were combined with data on morbidity among adults and children, specifically the occurrence of malaria, cough, and diarrhea. Combinations of indicators have led to a classification of households as being very vulnerable, vulnerable, nearly vulnerable and not vulnerable. This data set was produced in the framework of the "Climate change predictions in Sub-Saharan Africa: impacts and adaptations (ClimAfrica)" project, Work Package 5 (WP5). More information on ClimAfrica project is provided in the Supplemental Information section of this metadata. This study in WP5 aimed to identify, locate and characterize groups that are vulnerable for climate change conditions in two country clusters; one in West Africa (Benin, Burkina Faso, Côte d'Ivoire, Ghana, and Togo) and one in East Africa (Sudan, South Sudan and Uganda). Data used for the study include the Demographic and Health Surveys (DHS) , the Multi Indicator Cluster Survey (MICS) and the Afrobarometer surveys for the socio-economic variables and grid level data on agro-ecological and climatic conditions.
-
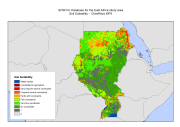
The soil suitability map combines various soil constraints to calculate the area share where agricultural activities are seriously restricted. The agro-edaphic suitability classification is to a large extent based on experience documented by Prof. C. Sys and others (e.g. FAO, 1978-81a; Sys and Riquier, 1980). The suitability rating is based on a comparison of a general soil requirement assessment for crop growth and prevailing edaphic conditions. This dataset has been used to complement the survey data and included in the "Climate change predictions in Sub-Saharan Africa: impacts and adaptations (ClimAfrica)" project, Work Package 5 (WP5). This study in WP5 aimed to identify, locate and characterize groups that are vulnerable for climate change conditions in two country clusters; one in West Africa (Benin, Burkina Faso, Côte d'Ivoire, Ghana, and Togo) and one in East Africa (Sudan, South Sudan and Uganda). Data used for the study include the Demographic and Health Surveys (DHS) , the Multi Indicator Cluster Survey (MICS) and the Afrobarometer surveys for the socio-economic variables and grid level data on agro-ecological and climatic conditions. More information on ClimAfrica project is provided in the Supplemental Information section of this metadata.
-
Vulnerable population identified by the nutritional status of women (BMI) as indicator for food security, in sample of households in East Africa study area. Data based on DHS and MICS surveys. In defining vulnerability, WFP (2009) and IFPRI (2012) have been followed and combined with indicators for food security with health indicators that signal vulnerability in a physical sense. IFPRI's Global Hunger Index uses three indicators to measure hunger: the number of adults being undernourished, the number of children that have low weight for age, and child mortality. Other classifications of food security use the variety of the diet as an indicator, combined with anthropometric data on children. However, in the DHS data there were no information available on child mortality, nor on dietary composition. Given these data limitations, data on nutritional status of women (Body Mass Index, BMI) for women and children (weight for age) have been used as indicators for food security. These data were combined with data on morbidity among adults and children, specifically the occurrence of malaria, cough, and diarrhea. Combinations of indicators have led to a classification of households as being very vulnerable, vulnerable, nearly vulnerable and not vulnerable. This data set was produced in the framework of the "Climate change predictions in Sub-Saharan Africa: impacts and adaptations (ClimAfrica)" project, Work Package 5 (WP5). More information on ClimAfrica project is provided in the Supplemental Information section of this metadata. This study in WP5 aimed to identify, locate and characterize groups that are vulnerable for climate change conditions in two country clusters; one in West Africa (Benin, Burkina Faso, Côte d'Ivoire, Ghana, and Togo) and one in East Africa (Sudan, South Sudan and Uganda). Data used for the study include the Demographic and Health Surveys (DHS) , the Multi Indicator Cluster Survey (MICS) and the Afrobarometer surveys for the socio-economic variables and grid level data on agro-ecological and climatic conditions.
-

SOW-VU "Africa in maps" database updated from van Wesenbeeck and Merbis, 2012. These include population maps (total, urban, rural, refugees/IDPs), food aid distribution, and estimates of total production measured in mt cereal equivalents per capita. This data set have been used to complement the survey data and included in the 'Climate change predictions in Sub-Saharan Africa: impacts and adaptations (ClimAfrica)" project, Work Package 5 (WP5). WP5 deals with economic assessment of agriculture and water sector based on a Computable General Equilibrium analysis (ICES) to produce the "inaction" and the adaptation scenarios, for direct climate change impacts on agricultural activity and on the direct cost and effectiveness of adaptation strategies. The main advantage of this investigation approach is to depict the economy as a system where goods and factor markets interacts domestically and internationally. Price effects, competitiveness effects, and demand & supply adjustments triggered by impacts on the agricultural sector can thus be properly captured. Moreover, the spatially explicit and dynamic economic modeling of vulnerability will have to accommodate bio-physical vulnerabilities. More information on ClimAfrica project's scope and objectives is provided in the Supplemental Information section of this metadata.
-
This land cover dataset provides information on the land cover distribution by sub-basin divisions. The dataset was created using the FAO/GLCN methodology and tools. The land cover mapping was carried out with the interpretation of an integrated coverage of GLS Landsat satellite images (2000 and circa 2005-2007) acquired for the whole extent of South Sudan, and improved with updated higher resolution SPOT images (2006-2008) covering the agricultural areas. This approach was adopted to emphasize the land cover features in the agricultural production areas which were derived from the existing Africover Sudan data base dated circa 2002. The legend was prepared using the Land Cover Classification System (LCCS*). The sub-basins division of the land cover comes from the South Sudan hydrological basins layer (USGS HydroSHEDS) which identifies the following nineteen sub-basins: Akoba, Bahr al arab, Baro Wenz, Buhayrat abyad, Gelha, Khawr biban, Khawr tunbak, Khawr_marchar, Kidepo, Kwahr as sidrah, Kwahr m’ boloko, Lake turkana, Lotagipi swamp, Sopo, Sue, White nile 3, White nile 4, White nile 5 and White nile 6. *The LCCS is a comprehensive, standardized a priori classification system, designed to meet specific user requirements and created for mapping exercises, independent of the scale or means used to map. The classification uses a set of independent diagnostic criteria that allows the correlation with existing classifications and legends.