 FAO Map Catalog
Population
Type of resources
Available actions
Topics
Keywords
Contact for the resource
Provided by
Years
Formats
Representation types
Update frequencies
status
Scale
Resolution
-
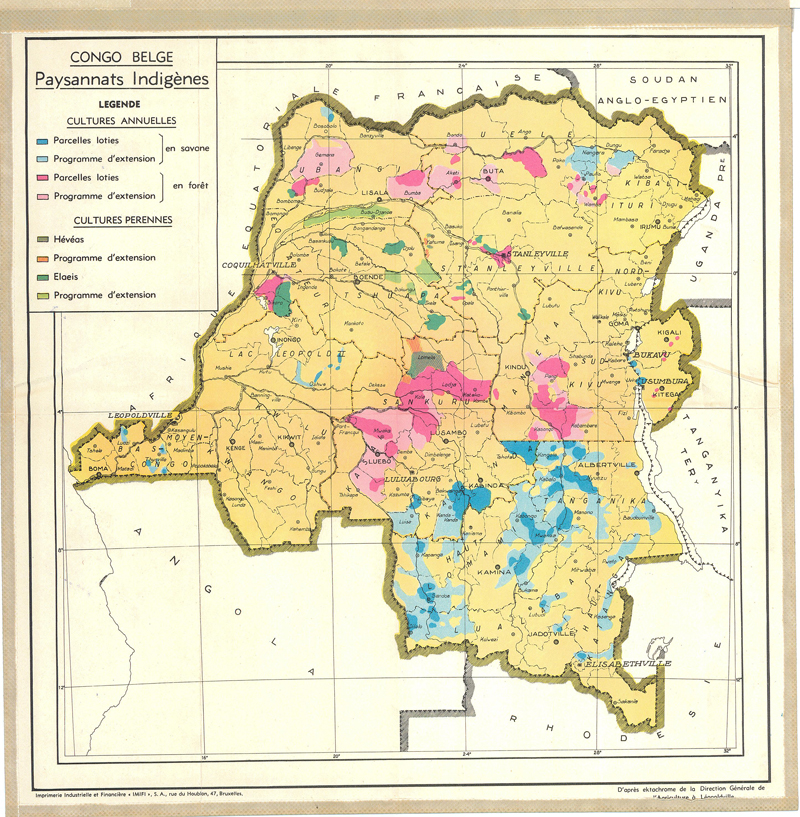
Coverage: Congo, Dem. , Burundi, Rwanda (Land use)
-
Data for the years 2000 and 2010 is from the Census of Population and Housing while Data for the other years (2001 to 2009 and 2011 to 2014) was projected. Muchinga has no data in the years 2000 to 2009 because it did not exist that time.. **Table content** - Year - Indicator - Item - Gaul - Value - Flag - Unit of Measure
-
Agriculture and Non-Agriculture populations were estimated by multiplying the number of Agriculture Households or the number of Non-Agriculture households by the average household size. This data is from the Census of Population and Housing for the years 2000 and 2010. It contains information on the distribution of households by whether the household is an agriculture household or not. The years from 2001 and 2009 and 2011 to 2014 are blank because estimates of agriculture and non agriculture households are not done between census years. **Table content** - Year - Indicator - Item - Value - Flag - Unit of Measure **Value assigned to No-data**:m
-
Mapa de la Republica de Honduras (Land in use for agriculture livestock excluded in % of total area)
Include : Land in use for agriculture livestock excluded in % of total area (fig. 6)
-
Data for the years 2000 and 2010 is from the Census of Population and Housing. Data for the other years (2001 to 2009 and 2011 to 2014) was projected. **Table content** - Year - Indicator - Item - Value - Flag - Unit of Measure
-
Include : Production of Cereals (fig. 2) Cattle Population (fig. 3) Planted Areas in % of total area (fig. 4) Land in use for agriculture livestock excluded in % of total area (fig. 6)
-
Data for the years 2000 and 2010 is from the Census of Population and Housing. Data for the other years (2001 to 2009 and 2011 to 2014) was projected. Muchinga has no data in the years 2000 to 2009 because it not exist that time. **Table content** - Year - Indicator - Item - Gaul - Value - Flag - Unit of Measure
-

Include : Planted Areas in % of total area (fig. 4)
-
Agriculture and Non-Agriculture populations were estimated by multiplying the Number of Agriculture Households or the Number of Non-Agriculture Households by the average household size. Data for the years 2000 and 2010 is from the Census of Population and Housing. Data for the other years (2001 to 2009 and 2011 to 2014) was projected. Muchinga Province has no data in the years 2000 to 2009 because it did not exist that time. There is no data in the years 2001 to 2009 and 2011 to 2014 because there are no projections for Agriculture and Non Agriculture population. **Table content** - Year - Indicator - Item - Gaul - Value - Flag - Unit of Measure
-

Include : Cattle Population (fig. 3)