 FAO Map Catalog
Pakistan
Type of resources
Available actions
Topics
Keywords
Contact for the resource
Provided by
Years
Formats
Representation types
Update frequencies
status
Scale
Resolution
-

This map is representing Drought index at district level of Pakistan. A drought hazard map is prepared by keeping in view the geography and climatology of the districts of Pakistan. The long-term data are analyzed to determine the historical drought frequency and intensity, monthly and seasonal precipitation dependencies, soil moisture anomaly, cumulative rainfall deficit, and the area deficit for each district. Sources: Analysis is based on the study done by personnel at Pakistan Meteorological Department of Pakistan. The precipitation data on a resolution of 0.5◦×0.5◦ were obtained from the Global Precipitation Climatological Center (GPCC). Link: http://www.esrl.noaa.gov/psd/data/gridded/data.gpcc.html Data Accusation Method: A regional drought identification model (ReDIM) was adopted in this study. It uses the Standardized precipitation index (SPI) and Run method (RM) to determine historical drought events, return period, regional drought analysis, and water deficit period. Definition of variables: Drought Hazard Index is represented by Drought_Ha field. It is based on following criteria: • Low • Medium • High Time Period: This study is based on Meteorological data from 1951-2010
-

This map represents the distribution of sampled households according to their level of food security as measured by Food Insecurity Experience Scale (FIES) at district level of Pakistan. More than half of the households (63.1%) were found to be “food secure”. In urban areas, 68.2% of households were food secure compared to 60% in rural areas. A larger percentage of households were food secure in Gilgit Baltistan (75.6%) and Khyber Pakhtunkhwa (70.9%), with smaller proportions in Balochistan (50.3%) and Khyber Pakhtunkhwa Newly Merged Districts (54.6%). Nationally, 18.3% of households experienced severe food insecurity (urban: 13.9%; rural: 20.9%). Household food security was lowest in the poorest wealth quintile, with 42.1% of these households reporting severe food insecurity. Food insecurity in all districts was also assessed. Districts in Balochistan exhibited the highest degree of food insecurity, with particularly low rates of food security (i.e. high rates of food insecurity) observed in Awaran (0.2%), Jhal Magsi (3.8%) and Dera Bugti (9.0%). Sindh also had low food security (Tando Mohammad Khan: 15.8%; Sujawal: 19.3%; Tharparkar: 21.2%) also exhibited a high prevalence of food insecurity. By comparison, the lowest degree of food insecurity in Punjab was 37.8%, found in Lodhran, although low rates were also observed in Khyber Pakhtunkhwa Newly Merged Districts and Khyber Pakhtunkhwa, including FR Dera Ismail Khan (11.0%) and Mohmand Agency (13.6%). Data Sources: The Ministry of National Services Regulation and Coordination (MoNHSR&C), Government of Pakistan, in collaboration with UNICEF and the United Kingdom's Department for International Development (DFID), developed and carried out the National Nutrition Survey (NNS) 2018. Definition of variables and data sources: Percentage values for Food Insecurity Experience Scale (FIES) is represented by “severe” field. Data Accusation Method: Demographics and Health Survey Methodology to prepare this dataset can be accessed at: https://www.unicef.org/pakistan/media/2836/file/National%20Nutrition%20Survey%202018%20Volume%203.pdf Survey Time Period: The survey was initiated in April 2018 and field activities formally ended in January 2019.
-

Multi-Dimensional Poverty Index is a new measure to compute acute poverty. The MPI complements consumption-based poverty measures by reflecting deprivations that individuals face in other dimensions such as education, health and standard of living. The MPI captures the severe deprivations that each person experiences with respect to education, health and standard of living. MPI is the product of two components: 1) Incidence of poverty (H): the percentage of people who are identified as multidimensionally poor, or the poverty headcount. 2) Intensity of poverty (A): the average percentage of dimensions in which poor people are deprived. In simple terms it means how intense, how bad the multidimensional poverty is, on average, for those who are poor. Based on the index values for the latest year (2014/15), the five districts with the highest MPI are Killa Abdullah, Harnai, Barkhan, Kohistan and Ziarat. Most of these districts also have the highest levels of the incidence (headcount) and intensity of poverty in all of Pakistan. On the other hand, the six districts with the lowest index value are Islamabad, Lahore, Karachi, Rawalpindi, Jhelum and Attock. These districts also have the lowest poverty headcounts in the country. Data Sources: Data is taken from the report on Multidimensional Poverty which has been developed in collaboration with the Oxford Poverty and Human Development Initiative (OPHI) and the United Nations Development Programme (UNDP), Pakistan. Data Accusation Method: The methodology used to determine Pakistan's MPI is adopted from Alkire and Santos' (2010, 2014) work on the global MPI, undertaken in collaboration with UNDP. Time Period: 2014/15 Definition of variables Multi-Dimensional Poverty Index is represented by "MPI_incide" field. Introduction about Data: This map allows to explore Multi-Dimensional Poverty Index at district level of Pakistan.
-

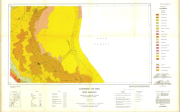
Include: Generalized salinity map of Punjab and Sind
-
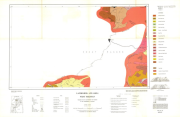
Include: Nawabshah (Map No 5)
-

Include: Gandava (Map No 8)
-
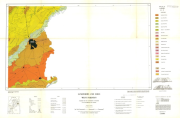
Include: Kohat (Map No 23)
-

Include: Khairpur (Map No 7)
-
Include: Mianwali (Map No 20)
-
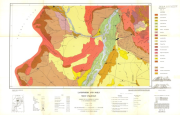
Include: Lahore (Map No 19)