 FAO Map Catalog
Ghana
Type of resources
Available actions
Topics
Keywords
Contact for the resource
Provided by
Years
Formats
Representation types
Update frequencies
status
Scale
Resolution
-
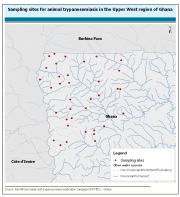
This dataset contains information on animal trypanosomiasis in the Upper West region of Ghana. It was generated within the framework of a tsetse and trypanosomiasis elimination campaign (Pan-African tsetse and trypanosomiasis eradication campaign (PATTEC) - Ghana).
-
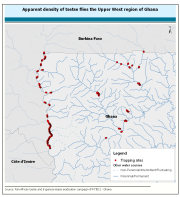
This dataset contains information on the apparent density of tsetse flies in the Upper West region of Ghana. It was generated within the framework of a tsetse and trypanosomosis elimination campaign (Pan-African tsetse and trypanosomosis eradication campaign (PATTEC) - Ghana).
-
This map shows areas suitable for the Agricultural Water Management interventions as identified by the project. The assessment is based primarily on each intervention's bio-physical requirements (such as: climate, proximity to water resources, terrain), but it also includes a qualitative rating based on infrastructural settings (namely distance to markets).
-
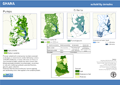
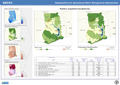
Livelihood zoning consists in identifying areas where rural people share relatively homogeneous living conditions, on the basis of a combination of biophysical and socio-economic determinants. The main criteria to establish livelihood zones are: the predominant source of income (livelihood activities); the natural resources available to people and the way they are used; and the prevailing agroclimatic conditions that influence farming activities. Patterns of livelihood vary from one area to another, based on local factors such as climate, soil or access to markets. The analysis delineates geographical areas within which people share similar livelihood patterns: source of living, access to food, farming practices, including crops, livestock and access to markets. The map of livelihood zones is the main output from a participatory mapping workshop and forms the basis for the overall AWM assessment. It describes and geographically locates the different country livelihood contexts, focusing on the main smallholders’ livelihood strategies, their water-related problems and other constraints for development, and the role agricultural water management plays for their livelihoods. An attribute table provides a detailed description of each livelihood zone.
-

Crop Storage Location Score: Aggregated Production (Ghana - ~1km), consists of a raster grid covering the country with 0.01 decimal degrees resolution, produced under the scope of the sub-Saharan Covid-19 African Corridor project pilot case, using raster-based Geographical Information Systems - Multicriteria Decision Analysis (GIS-MCDA) for the identification and definition of mobile storage locations (movable warehouses). The modeling variables characterize supply, demand and accessibility, main logistical factors for warehousing facilities location. These variables are, major crops (supply), human population density (demand) and main transportation network infrastructure (accessibility). The location score is obtained by way of a simple arithmetic weighted sum calculation (raster calculator tool) of reclassified grids, generating a location score varying from 0 to 3. The assumed weight for each of the criteria is as follows. ("Crop Production" * 0.4) + ("Human Population Density" * 0.3) + ("Cumulative Travel Time/Cost" * 0.3)
-
This map shows where AWM can be the entry point for improving livelihoods and where to prioritize investments in AWM to have the maximum impact on rural livelihoods. High potential areas are those showing the highest potential for AWM investment. These areas are identified on the basis of three guiding principles: 1) where water is available 2) where the target beneficiaries are mostly located; and 3) where water is key for livelihoods.
-

Ghana Major Cities Accessibility Map represents an estimated cumulative travel time/cost (raster grid) accessibility map, for Ghana's major cities . The map is an output of the sub-Saharan African Corridor pilot project for Mobile Warehouse Location . Modeled cities are: Accra (5,390,455); Kumasi (2,477,604); Cape Coast (1,256,805); Sékondi/Takoradi (726,905); Tamale (562,919) - https://www.populationdata.net/pays/ghana/. The calculation of cost/time distance surfaces is based on some assumptions: A. Road travel time/cost is computed for large trucks, it is assumed accessibility for large cargo freight vehicles, tertiary and local traffic roads are not included; B. Lake and river navigation are treated as a surface (polygons) not taking into consideration navigation infrastructure (points). Travel time surface production steps are: rasterization of transportation network and surfaces and definition of cell travel time; creation of time/cost; computation of a cumulative cost/time accessibility layer to cities .
-

Crop Storage Final Location: Aggregated Production, consists of a 0.01 decimal degree grid produced under the scope of the Covid-19 sub-Saharan African Corridor project pilot case, using a Geographical Information Systems - Multicriteria Decision Analysis (GIS-MCDA) methodology for the identification and definition of mobile storage locations (movable warehouses). The Top Score Locations were computed using the Location Score raster and adding as criteria, access to finance (distance to bank agency) and linear distance from major roads. This output step filters the location score grid (aggregated production) into a top location score raster. Applying the following functions: • Buffering: o Banks - 10km (0.09 degree) buffer radius; o Major roads - 2km (0.18 degree) buffer radius; • Intersection - extracts the overlapping portions of Banks_Buffer and Roads_Buffer. • Dissolve - Takes the intersection vector layer and combines the features into a new feature, a single polygon; • Clip Raster by Mask Layer - Extracts the raster-production aggregate location score using the polygon obtained by the dissolved intersection of the banks and roads buffers; • The raster pixel cell in the final areas are classified into the final location map.
-

Crop Storage Location Score: Aggregated Production consists of a raster grid covering the country with 0.01 decimal degrees resolution, produced under the scope of the sub-Saharan Covid-19 African Corridor project pilot case, Geographical Information Systems - Multicriteria Decision Analysis (GIS-MCDA) for the identification and definition of mobile storage recommended locations (movable warehouses). The modeling variables characterize supply, demand and accessibility, main logistical factors for warehousing facilities location. These variables are, major crops (supply), human population density (demand) and main transportation network infrastructure (accessibility). Crops included in the production aggregate are the coutry's major crops (FAOStat data):Cassava, Yams, Plantains and cooking Bananas, Maize (corn), Taro, Cocoa beans, Rice, Groundnuts, Oil palm fruit. The location score results of a simple arithmetic weighted sum calculation (cell statistics) of normalized grids, generating a location score varying from 0 to 100. The assumed weight for each of the criteria is as follows. ("Crop Production" * 0.4) + ("Human Population Density" * 0.2) + ("Port Accessibility" * 0.2) + ("Cities Accessibility" * 0.1) + ("Regional Cities Accessibility" * 0.1)
-
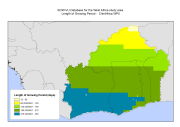
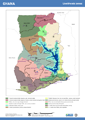
The Length of Growing Period (LGP) refers to the average duration when moisture availability allows crop growth. The calculation is based on a water balance model that compares moisture supply from precipitation, soil moisture storage and a reference evapotranspiration. The reference LGP assumes available soil moisture capacity of 100 mm per meter soil depth and a reference soil depth of one meter. LGP's were based on the baseline period of 1961-1990. This dataset has been used to complement the survey data and included in the "Climate change predictions in Sub-Saharan Africa: impacts and adaptations (ClimAfrica)" project, Work Package 5 (WP5). More information on ClimAfrica project is provided in the Supplemental Information section of this metadata. This study in WP5 aimed to identify, locate and characterize groups that are vulnerable for climate change conditions in two country clusters; one in West Africa (Benin, Burkina Faso, Côte d'Ivoire, Ghana, and Togo) and one in East Africa (Sudan, South Sudan and Uganda). Data used for the study include the Demographic and Health Surveys (DHS) , the Multi Indicator Cluster Survey (MICS) and the Afrobarometer surveys for the socio-economic variables and grid level data on agro-ecological and climatic conditions.