 FAO Map Catalog
Environment
Type of resources
Available actions
Topics
Keywords
Contact for the resource
Provided by
Years
Formats
Representation types
Update frequencies
status
Scale
Resolution
-

The Congo forest cover change map 2000-2012 was created by the national forest services of Congo (CNIAFF) in collaboration with UN-REDD programme. It builds on 3 existing products that are combined to comply with the national forest definition (30% tree cover, 0.5 ha MMU). It is stratified into 3 forest types (Primary, Secondary, Primary/Swamp)
-
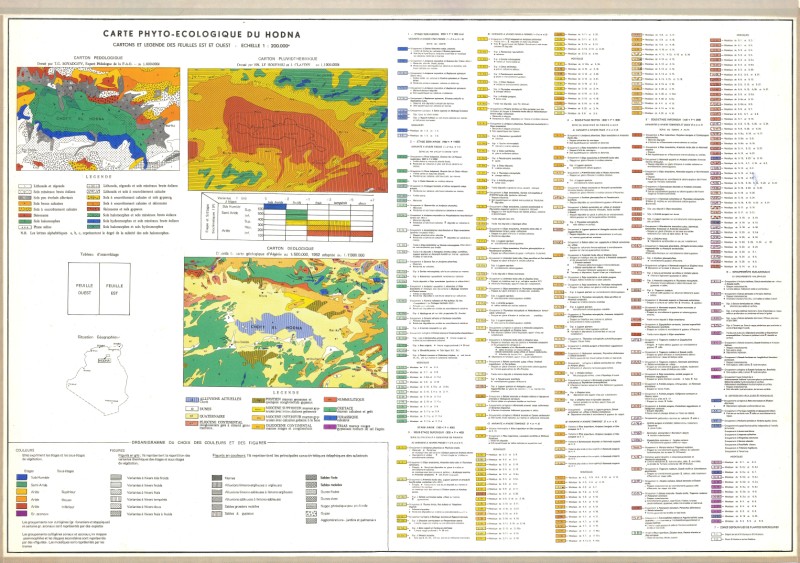
Include : Carte Phyto-Ecologique du Hodna (Cartons et legende des fuilles est et ouest) (200 000)
-
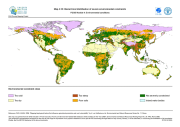
The FGGD severe environmental constraints map is a global raster datalayer with a resolution of 5 arc-minutes. Pixels with no severe environmental constraints contain a value of zero. Each other pixel contains a cumulative class value that shows which environmental constraint is binding in the pixel area. The data are from FAO and IIASA, 2000, Global agro-ecological zones, as reported in FAO and IIASA, 2007, Mapping biophysical factors that influence agricultural production and rural vulnerability, by H. von Velthuizen et al.
-
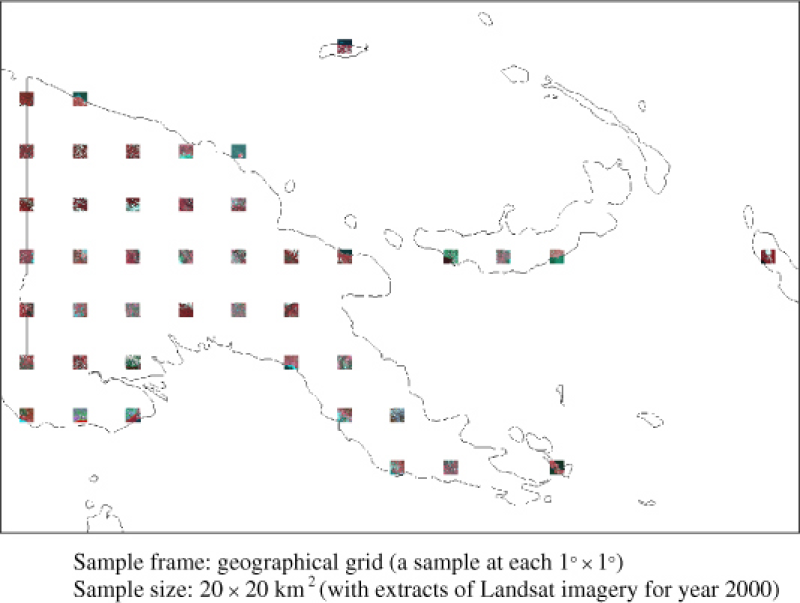
The Global Forest Resources Assessment 2010 (FRA 2010) is based on a statistically suitable Remote Sensing Survey (RSS) approach. To implement the approach, a systematic sample has been drawn using each longitude and latitude intersection for surface area between 90 degrees South and 90 degrees North on a 1 degree GRID of the whole land surface of the Earth (see figure above). Some modifications in the sampling procedure are introduced for polar surface area, due to the curvature of the Earth. This sampling scheme leads to circa 13,500 samples, of which about 9,000 samples are outside deserts and areas with permanent ice. They represent circa 1 percent of the gridded land surface (0.8 percent along the equator). To implement the survey, a 10 Ã 10 km2 square is overlayed on each intersection and these squares comprise the sample plots (double click on the figure). In order to interpret the significance of the remote sensed data in the sample plots, a 5 km buffer (i.e., size of 20 Ã 20 km2) is placed around each plot in order to contextualise the land cover information. These dimensions were chosen to allow monitoring at a scale relevant to land management. Time-series of mid-resolution remote sensing data will be attached to each sampling location through a quality-controlled, standardized and decentralized process. The RSS for FRA 2010 was tested in the pan-tropical zone by JRC/FAO??/University of Maryland and SDS University and now it will be extended to all land surfaces. The survey aims to estimate forest change for the periods 1990 /2000/2005 based on a sample of freely available mid-resolution satellite imagery (e.g. Landsat TM, ETM + probably ASTER, and RADAR in areas with severe cloud cover constraint) as primary sources for trend analysis. A 30-year historical trend will be added by looking back to the year 1975 (with Landsat MSS), helping to establish comparable historical rates of deforestation and forest expansion. This method for determining the location of sample plots on a remote sensing grid is the same as that used for the national forest assessments supported by FAO and by many national forest inventory programmes. Estimates of forest areas and change rates are meant to be statistically valid at global, continental and sub-regional levels. This approach is expected to deliver regionally accurate estimation of forest cover change, as well as national estimates for those countries where sampling intensity is sufficient.
-
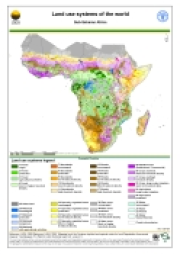
Version 1.1 of a thematic grid of Land Use Systems (LUS) and its attributes for Sub-Saharan Africa with a spatial resolution of 5 arc minutes or 0.083333 decimal degrees. This dataset is developed in the framework of the LADA project (Land degradation Assessment in Drylands) by the Land Tenure and Management Unit of the Food and Agriculture Organization of the United Nations and is copyright of FAO/UNEP GEF. The LUS map implementation is based on a innovative methodology combining more than 10 global datasets. Due to the map generation method, the quality of the map can never be uniform. The overall quality of the map depends heavily on the individual quality of the data for the different countries.
-
The FGGD protected areas map is a global raster datalayer with a resolution of 5 arc-minutes. Each pixel is classified as protected area where agriculture should not be occurring, protected area where agriculture could be occurring, or non-protected area. The data are taken from the UNEP-WCMC World database on protected areas, 2003.
-
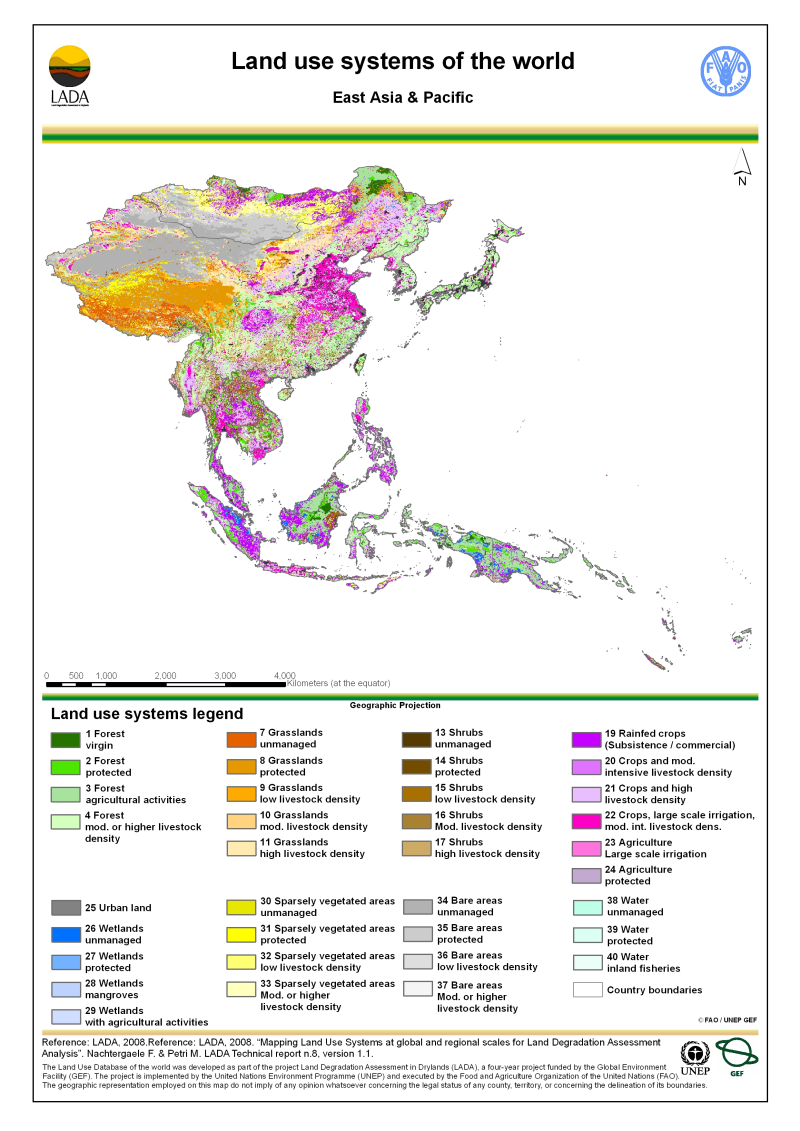
Version 1.1 of a thematic grid of Land Use Systems (LUS) and its attributes for East Asia and Pacific with a spatial resolution of 5 arc minutes or 0.083333 decimal degrees. This dataset is developed in the framework of the LADA project (Land degradation Assessment in Drylands) by the Land Tenure and Management Unit of the Food and Agriculture Organization of the United Nations and is copyright of FAO/UNEP GEF. The LUS map implementation is based on a innovative methodology combining more than 10 global datasets. Due to the map generation method, the quality of the map can never be uniform. The overall quality of the map depends heavily on the individual quality of the data for the different countries.
-
Version 1.1 of a thematic grid of Land Use Systems (LUS) and its attributes with a spatial resolution of 5 arc minutes or 0.083333 decimal degrees. This dataset is developed in the framework of the LADA project (Land degradation Assessment in Drylands) by the Land Tenure and Management Unit of the Food and Agriculture Organization of the United Nations and is copyright of FAO/UNEP GEF. The LUS map implementation is based on a innovative methodology combining more than 10 global datasets. Due to the map generation method, the quality of the map can never be uniform. The overall quality of the map depends heavily on the individual quality of the data for the different countries.
-

Version 1.1 of a thematic grid of Land Use Systems (LUS) and its attributes for Sub-Saharan Africa with a spatial resolution of 5 arc minutes or 0.083333 decimal degrees. This dataset is developed in the framework of the LADA project (Land degradation Assessment in Drylands) by the Land Tenure and Management Unit of the Food and Agriculture Organization of the United Nations and is copyright of FAO/UNEP GEF. The LUS map implementation is based on a innovative methodology combining more than 10 global datasets. Due to the map generation method, the quality of the map can never be uniform. The overall quality of the map depends heavily on the individual quality of the data for the different countries.
-
The VNP22Q2 dataset provides yearly land surface phenology data for the period from 2013 to present. The VNP22Q2 product generates phenological metrics of individual vegetation growing cycles on the vegetated land surface with a spatial resolution of 500m at global level between 60°S to 80°N. The 500m VIIRS GLSP product is a level 3 product and follows the structure and file format of the high level global VIIRS data. For more detail, please visit the website of the data provider: https://lpdaac.usgs.gov/products/vnp22q2v001/