 FAO Map Catalog
Cattle
Type of resources
Available actions
Topics
Keywords
Contact for the resource
Provided by
Years
Formats
Representation types
Update frequencies
status
Resolution
-

The raster dataset consists of a 500m score grid for slaughterhouse industry facilities siting, produced under the scope of FAO’s Hand-in-Hand Initiative, Geographical Information Systems - Multicriteria Decision Analysis for value chain infrastructure location. The analysis is based on cattle production intensification potential defined using crop production, livestock production systems, and cattle distribution. The score is achieved by processing sub-model outputs that characterize logistical factors: 1. Supply - Feed, livestock production systems, cattle distribution. 2. Demand - Human population density, large cities, urban areas. 3. Infrastructure - Transportation network (accessibility). It consists of an arithmetic weighted sum of normalized grids (0 to 100): ("Crop Production" * 0.2) + ("Human Population Density" * 0.2) + (“Major Cities Accessibility” * 0.2) + (”Cattle intensification” * 0.3) + (“Poverty” * 0.1).
-
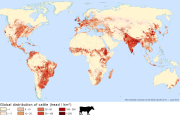
This data-set shows the most recent global model of the cattle distribution. It is the first update (version 2.01) of the recently published Gridded Livestock of the World (GLW) 2.0 (May 2014). More information and access to the data of the GLW 2.0 are in the dedicated web-site: http://livestock.geo-wiki.org/ The GLW 2007 remains available for download in FAO Geonetwork. However, a quantitative assessment of change is not possible between the GLW 2007 and the GLW 2.0 (and its updates) due to different modeling techniques, spatial resolution, predicting variables and training data. The bibliographic reference to the GLW 2.0 and its updates is: Robinson TP, Wint GRW, Conchedda G, Van Boeckel TP, Ercoli V, Palamara E, Cinardi G, DâAietti L, Hay SI, and Gilbert M. (2014) Mapping the Global Distribution of Livestock. PLoS ONE 9(5): e96084. doi:10.1371/journal.pone.0096084 The supplementary information includes a list of the observed data used to train this version of the cattle model.
-

The 500m raster dataset represents selected top location score areas filtered by exclusive criteria: access to finance, distance to major roads, access to IT, and distance to urban areas. The layer was produced under the scope of FAO’s Hand-in-Hand Initiative, Geographical Information Systems - Multicriteria Decision Analysis for value chain infrastructure location. The location score is achieved by processing sub-model outputs characterizing logistical factors for the slaughterhouse facilities siting: Demand, Supply, Infrastructure/accessibility. The top 99th percentile is selected/clipped using the exclusive criteria. Access to finance, distance to roads and urban areas are defined using a linear distance threshold: • Banks - approx. 20km (0.18 degree) buffer radius. • Major roads - approx. 2km (0.018 degree) buffer radius. • Access to IT is characterized by applying the mobile broadband coverage map.
-

Gridded Livestock of the World v3 This dataset contains the most up to date version of GLW 3 for the reference year 2010 and the following species: cattle, sheep, goats, buffaloes, horses, pigs, chickens and ducks. The individual species datasets are available at global extent and 5 minutes of arc resolution (approx. 10 km at the equator), and national extent 30 seconds of arc resolution (approx. 1 km at the equator) will be added as they become available. GLW 3 mainly differs from previous GLW versions in that the input data has been improved, the downscaling algorithm has been updated (Random Forest) and much more detailed metadata has been provided. All datasets are licensed through a Creative Commons Attribution 4.0 International License. Animal Density using the dasymetric method (DA). This method assigns different weights to different pixels based on high resolution environmental predictor variables and Random Forest models, and the animal census counts are distributed according to these weights. This layer contains the DA density of animals per pixel, with weight estimated by the Random Forest model. The DA GLW models provide an estimate of how livestock species may be distributed within census areas. However, spatial predictors (e.g. human population density, vegetation indices, topography, etc.) that are used to derived the downscaling weights may introduce some uncontrolled counfonding effects for users willing to quantify the effect of livestock alongside these spatial predictors on an outcome. Similarly, the DA models may introduce circularity for users willing to use livestock data to study their impact on some these spatial factors, such as land-use, for example. Unit : heads/km² Data type: Float64 No data value -9999 Spatial resolution: Approximately 10km (0.08333 degrees) Spatial extent: World Spatial Reference System (SRS): EPSG:4326 - WGS84 - Geographic Coordinate System (lat/long)