 FAO Map Catalog
CO2
Type of resources
Available actions
Topics
Keywords
Contact for the resource
Provided by
Formats
Representation types
Update frequencies
status
-
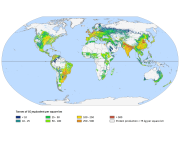
This data set represents the carbon dioxide emission intensity values per pixel with 5 minutes arc resolution. A raster layer containing the surface area of each cell within the thematic map is also available for download as ancillary dataset. Source: GLEAM
-
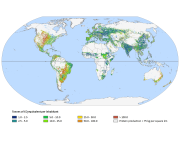
This dataset represents the total GHG emissions from livestock supply chains per capita. Source: GLEAM. GIS data for human population: Dobson et al., Land Scan: a global population database for estimating populations at risk. 2000 A raster layer containing the surface area of each cell within the thematic map is also available for download as ancillary dataset. Source: GLEAM
-
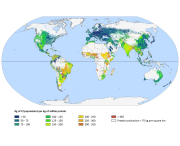
This data set represents the total GHG emissions from livestock supply chains per kilogram of edible protein from meat, milk and eggs. A raster layer containing the surface area of each cell within the thematic map is also available for download as ancillary dataset. Source: GLEAM
-

Map of dairy cattle GreenHouse Gas (GHG) emissions. Emissions are reported as CO2 eq. emissions, based on a 100 year global warming potential (GWP100 fb cc) conversions factors (which for methane is 34, and for nitrous oxide is 298). Milk production from the dairy cattle sector in Ethiopia accounted for about 116.3 million tonnes CO2 eq. in 2013 (FAO & New Zealand Agricultural Greenhouse Gas Research Centre, 2017). These emissions are distributed throughout the entire country as shown in the map. Approximately 87 % of the emissions arise from methane produced by the rumination of cattle and 10 % from the management of stored manure. Nitrous oxide arising from dung and urine contributes about 2.1 %. The contribution from the production of feed is negligible because the proportion of external inputs such as supplementary feed and fertilizer for feed production is low. Absolute emissions are concentrated in three regions, which together account 80% of the national dairy herd: Oromia (34 %), SNNPR (31 %) and Amhara (14 %). Source: FAO & New Zealand Agricultural Greenhouse Gas Research Centre. 2017. Supporting low emissions development in the Ethiopian dairy cattle sector – reducing enteric methane for food security and livelihoods. Rome. 34 pp. In this map, the Global Livestock Environmental Assessment Model (GLEAM; http://www.fao.org/gleam/en/) is the main analytical tool used to assess the emissions for the baseline year (2013). The spatially explicit GLEAM framework allows the incorporation of heterogeneity in emissions, emission reductions and production responses. The model was further developed to meet the needs of this study for Ethiopia. The dairy production systems in GLEAM were further refined to reflect the specificities of the dairy cattle production systems in Ethiopia and the database of production systems parameters was updated with more recent and system specific information and data on factors such as animal populations, performance parameters, feeding systems and manure management, taken from national databases.