 FAO Map Catalog
TIFF
Type of resources
Available actions
Topics
Keywords
Contact for the resource
Provided by
Years
Formats
Representation types
Update frequencies
status
Scale
Resolution
-
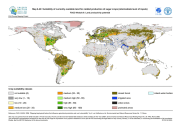
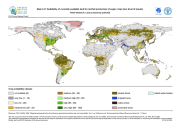
The FGGD crop suitability maps at low, intermediate and high levels of inputs under rainfed conditions on currently available land are global raster datalayers with a resolution of 5 arc-minutes. Pixels classified as urban, closed forest or irrigated contain values of zero. Each remaining pixel contains the 2005 version of the suitability index for rainfed production of the crop or crop group concerned. The method and crop coverage of each crop group are described in FAO and IIASA, 2007, Mapping biophysical factors that influence agricultural production and rural vulnerability, by H. von Velthuizen et al.
-

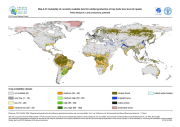
The FGGD crop suitability maps at low, intermediate and high levels of inputs under rainfed conditions on currently available land are global raster datalayers with a resolution of 5 arc-minutes. Pixels classified as urban, closed forest or irrigated contain values of zero. Each remaining pixel contains the 2005 version of the suitability index for rainfed production of the crop or crop group concerned. The method and crop coverage of each crop group are described in FAO and IIASA, 2007, Mapping biophysical factors that influence agricultural production and rural vulnerability, by H. von Velthuizen et al.
-
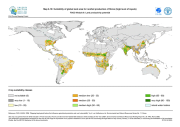
The FGGD crop suitability maps at low, intermediate and high levels of inputs under rainfed conditions on global land area are global raster datalayers with a resolution of 5 arc-minutes. Each pixel contains the 2005 version of the suitability index for rainfed production of the crop or crop group concerned. The method and crop coverage of each crop group are described in FAO and IIASA, 2007, Mapping biophysical factors that influence agricultural production and rural vulnerability, by H. von Velthuizen et al.
-
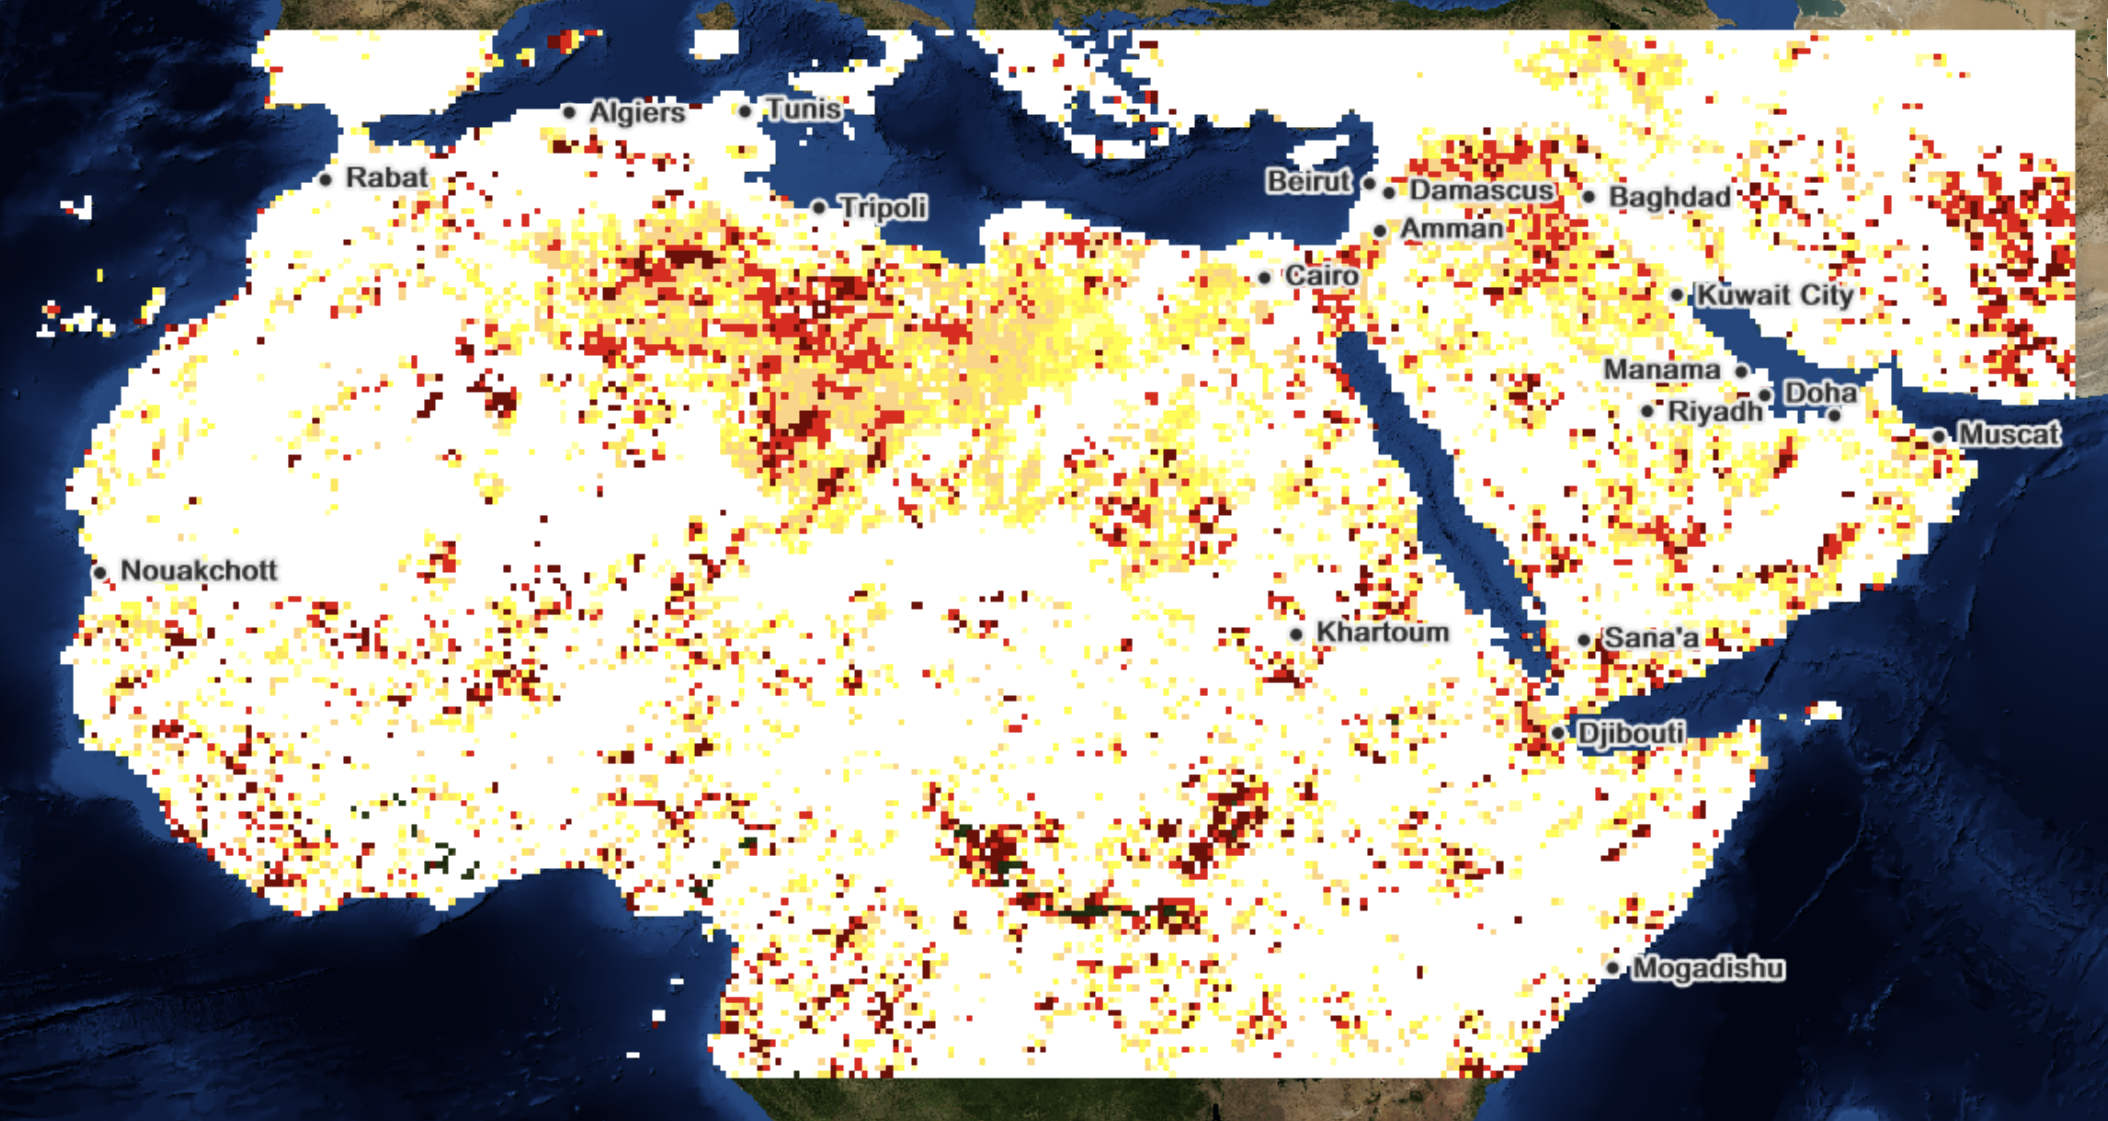
Surface temperature anomaly from MODIS highlighting whether conditions are warmer/cooler than usual for that month The data is published on MAWRED (Monitoring Agriculture and Water Resources during Droughts) and was generated by ICBA (International Centre for Biosaline Agriculture)
-
The FGGD crop suitability maps at low, intermediate and high levels of inputs under rainfed conditions on currently available land are global raster datalayers with a resolution of 5 arc-minutes. Pixels classified as urban, closed forest or irrigated contain values of zero. Each remaining pixel contains the 2005 version of the suitability index for rainfed production of the crop or crop group concerned. The method and crop coverage of each crop group are described in FAO and IIASA, 2007, Mapping biophysical factors that influence agricultural production and rural vulnerability, by H. von Velthuizen et al.
-
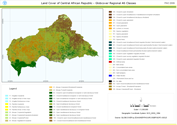
This land cover data set is derived from the original raster based Globcover regional (Africa) archive, post-processed to generate a vector version at national extent and apply the LCCS regional legend (46 classes) for being analyzed in the GLCN software Advanced Database Gateway (ADG). ADG software provides a user-friendly interface and advanced functionalities to breakdown the LCCS classes in their classifiers for further aggregations and analysis. The data set is intended for free public access. The shape file's attributes contain the following fields: -Area (sqm) -ID -Gridcode (Globcover cell value) -LCCCode (unique LCCS code) You can download a zip archive containing: -the shape file (.shp) -the ArcGis layer file with global legend (.lyr) -the ArcView 3 legend file (.avl) -the LCCS legend tables (.xls)
-
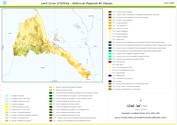
This land cover data set is derived from the original raster based Globcover regional (Africa) archive. It has been post-processed to generate a vector version at national extent with the LCCS regional legend (46 classes). This database can be analyzed in the GLCN software Advanced Database Gateway (ADG), which provides a user-friendly interface and advanced functionalities to breakdown the LCCS classes in their classifiers for further aggregations and analysis. The data set is intended for free public access. The shape file's attributes contain the following fields: -Area (sqm) -ID -Gridcode (Globcover cell value) -LCCCode (unique LCCS code) You can download a zip archive containing: -the shape file (.shp) -the ArcGis layer file with global legend (.lyr) -the ArcView 3 legend file (.avl) -the LCCS legend tables (.xls)