 FAO Map Catalog
3000000
Type of resources
Available actions
Topics
Keywords
Contact for the resource
Provided by
Years
Formats
Representation types
Update frequencies
status
Scale
-
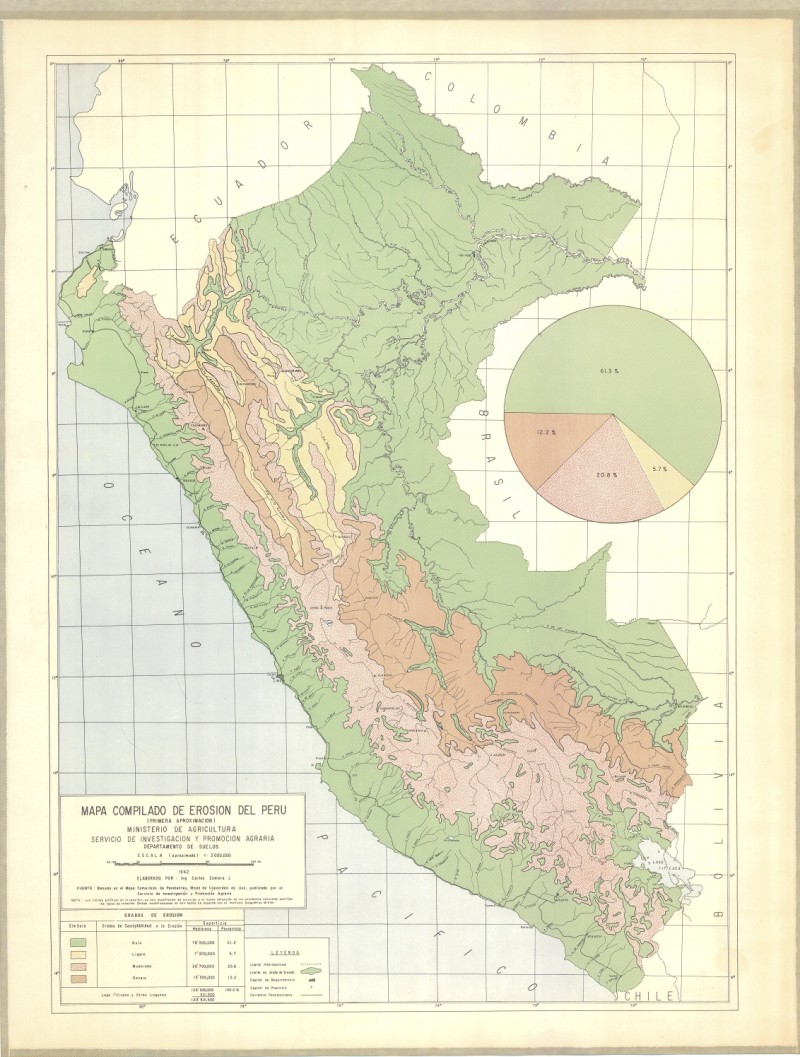
Mapa compilado de erosion del Peru
-
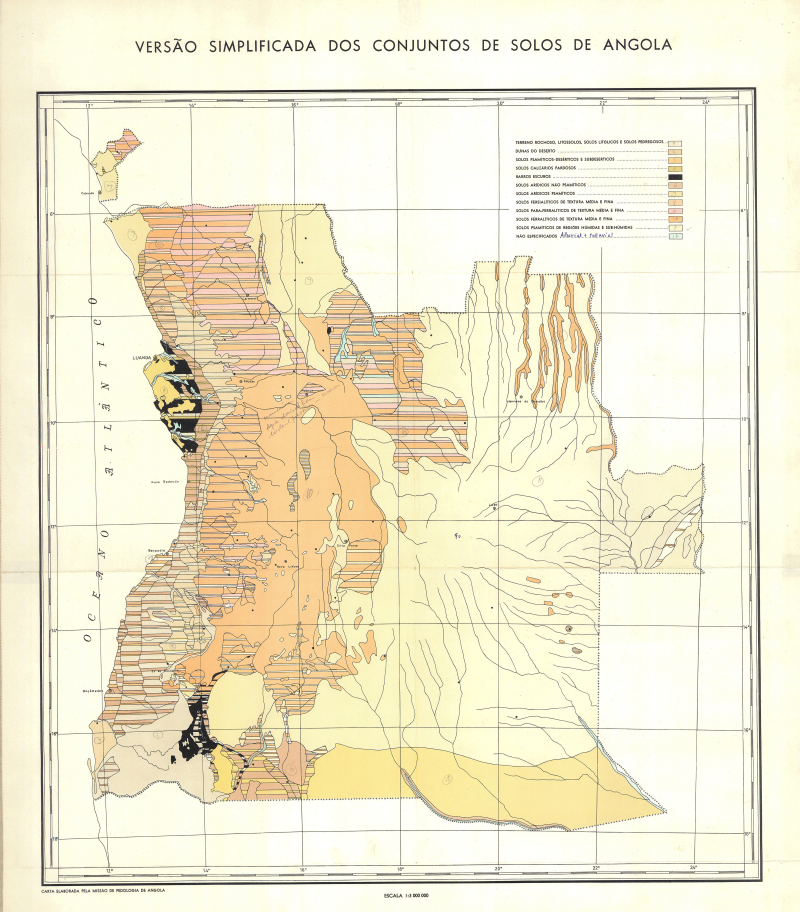
Simplified soil map of Angola
-
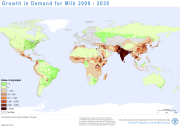
Livestock is one of the fastest-growing sectors in agriculture, potentially presenting opportunities for economic growth and poverty reduction in rural areas. Dealing with the important social, environmental and public health issues linked to sector growth will require solutions that embrace the way in which the livestock sector grows to meet the increasing demand for animal-source foods. It is then important to understand where growth in demand for livestock commodities is likely to occur, and how and where production of livestock commodities will be increased in order to meet it. Estimates of supply and demand for animal-source foods, provided by the Global Perspective Studies Unit at FAO, have been disaggregated spatially for the years 2000 and 2030. Demand for animal-source foods (beef, milk, mutton, pork, poultry meat and eggs) was mapped by estimating per-capita consumption and applying this to mapped population distributions in 2000. Population maps were produced for 2030 based on projected population growth and urbanisation rates and future estimates of per-capita demand applied to these. Similarly, livestock production maps were produced by spatially disaggregating the estimated production based on maps of the relevant livestock species. Methods and results are presented in the forthcoming FAO working paper âMapping Supply and Demand for Animal-Source Foods to 2030 (by T.P. Robinson and F. Pozzi, 2011). Grids and tabular data are distributed here by livestock product and by continent.
-

Ad2-Linear coastlines, national, 1st order subnational and other areas of sovereignty boundaries compiled from multiple RWDB2 source layers, circa 1997. The RWDB_AD2-LN shapefile data layer is comprised of 26648 derivative vector framework library features derived based on 1:3 000 000 data originally from RWDBII. The layer provides nominal analytical/mapping at 1:3 000 000. Data processing complete globally. Acronyms and Abbreviations: RWDB2 or RWDB II- Relational World Database II.
-

Mapa de capacidad de uso del Peru (Primera aproximacion)-
-

Include: Mapa de estudios hidrogeologicos
-

Point based representation of major port and harbours. The RWDB_PORT shapefile data layer is comprised of 4792 derivative vector framework library features derived based on 1:3 000 000 data originally from RWDBII. The layer provides nominal analytical/mapping at 1:3 000 000. Data processing complete globally. Acronyms and Abbreviations: RWDB2 or RWDB II- Relational World Database II.
-

Geology
-
Point based representation of Airports. The RWDB_APRT shapefile data layer is comprised of 15044 derivative vector framework library features derived based on 1:3 000 000 data originally from RWDBII. The layer provides nominal analytical/mapping at 1:3 000 000. Data processing complete globally. Acronyms and Abbreviations: RWDB2 or RWDB II- Relational World Database II.
-
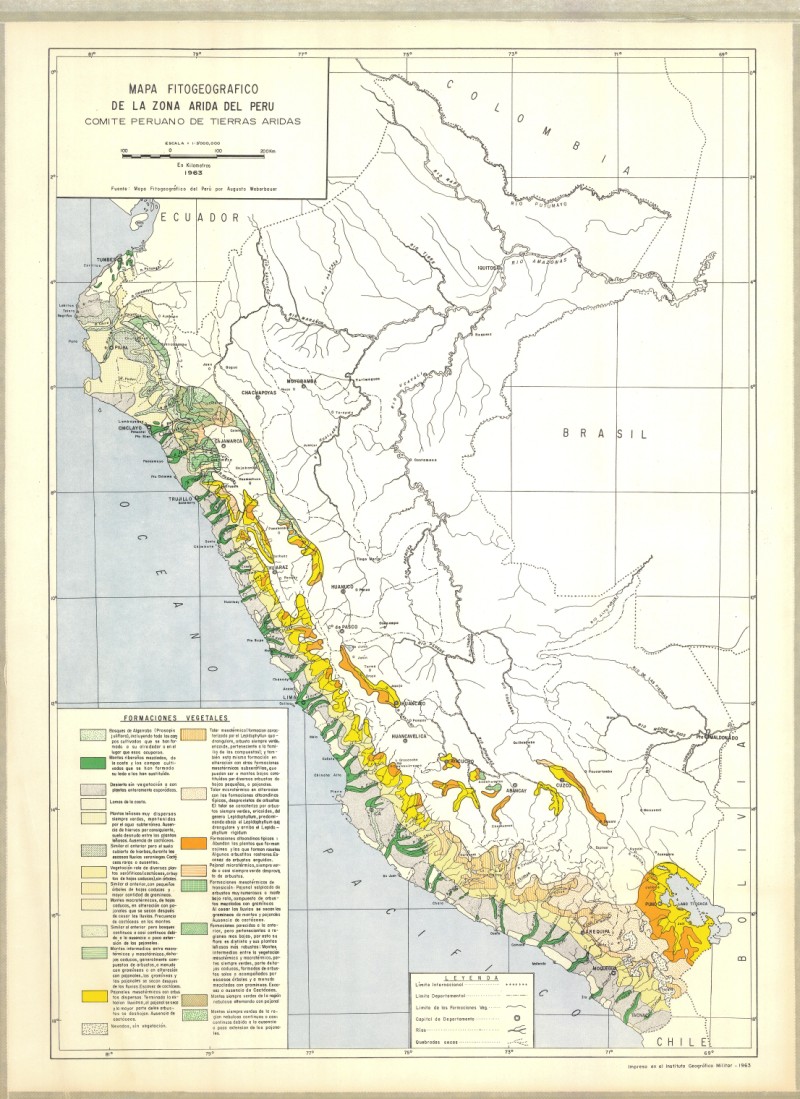
Include: Mapa fitogeografico (Weberbauer, A.)