 FAO Map Catalog
2013
Type of resources
Available actions
Topics
Keywords
Contact for the resource
Provided by
Years
Formats
Representation types
Update frequencies
status
Scale
Resolution
-
**Table content** - Year - Indicator - Product - Value - Flag - Unit
-
**Table content** - Year - Indicator - Sex - Administrative level 1 - Value - Flag - Unit
-
**Table content** - Year - Indicator - Administrative level 1 - Product - Value - Flag - Unit
-
Mouvement des prix mensuel des produits de première nécessité dans les régions de Madagascar **Table content** - Month - indicator - PRODUCT - REGION - price - flag - unit
-
**Table content** - Year - Indicator - Residence - Value - Flag - Unit
-
**Table content** - Year - Indicator - Residence - Value - Flag - Unit
-
**Table content** - Year - Indicator - Product - Value - Flag - Unit
-
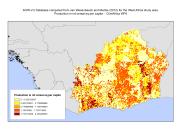
SOW-VU "Africa in maps" database updated from van Wesenbeeck and Merbis, 2012. These include population maps (total, urban, rural, refugees/IDPs), food aid distribution, and estimates of total production measured in mt cereal equivalents per capita. This data set have been used to complement the survey data and included in the "Climate change predictions in Sub-Saharan Africa: impacts and adaptations (ClimAfrica)" project, Work Package 5 (WP5). More information on ClimAfrica project is provided in the Supplemental Information section of this metadata. The study in WP5 aimed to identify, locate and characterize groups that are vulnerable for climate change conditions in two country clusters; one in West Africa (Benin, Burkina Faso, Côte d'Ivoire, Ghana, and Togo) and one in East Africa (Sudan, South Sudan and Uganda). Data used for the study include the Demographic and Health Surveys (DHS) , the Multi Indicator Cluster Survey (MICS) and the Afrobarometer surveys for the socio-economic variables and grid level data on agro-ecological and climatic conditions.
-
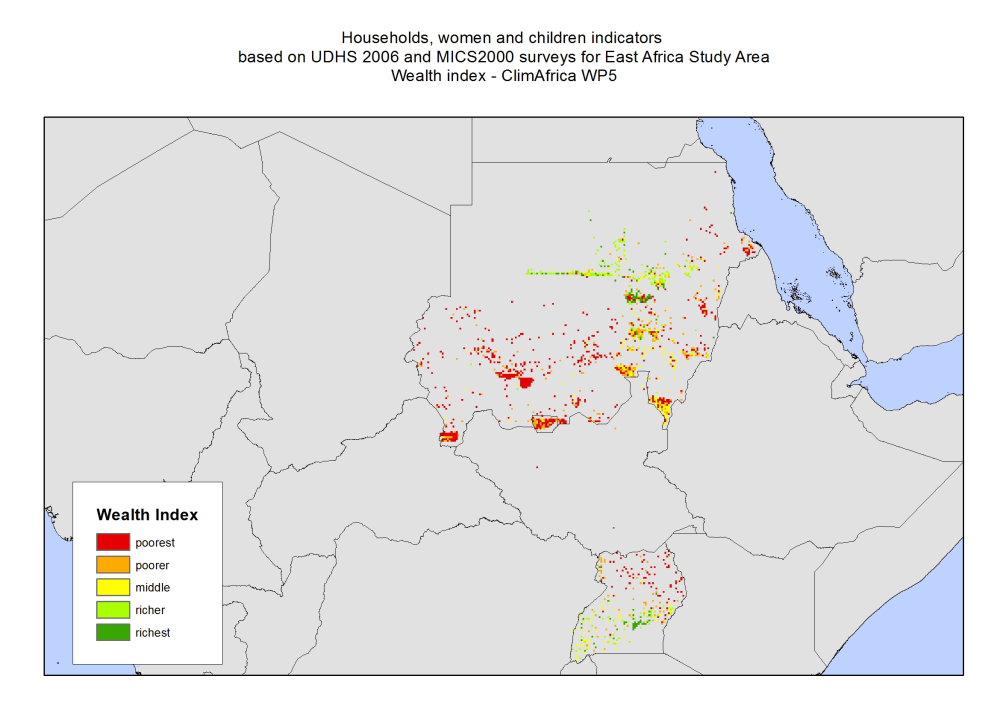
Households, women and children indicators based on the 2000 Sudan Multiple Indicator Cluster Survey (MICS2) and the Uganda Demographic and Health Survey (UDHS) 2006. DHS surveys are nationally representative household surveys that provide data for a wide range of indicators in the areas of population, health, and nutrition. Standard DHS surveys have large sample sizes (usually between 5,000 and 30,000 households) and are typically conducted about every 5 years, to allow comparisons over time. Multiple Indicator Cluster Survey (MICS) is an international household survey program developed by UNICEF. MICS data are collected during face-to-face interviews in nationally representative samples of households, generating one of the world's largest sources of statistical information on children and women. Since no DHS survey is available for Sudan and South Sudan, MICS surveys for 2000 for Sudan and South Sudan are used instead. The following indicators have been considered to create raster datasets at 5 arcmin resolution for Sudan, South Sudan and Uganda: wealth index, age and sex of the head of household, number of dependent household members (under the age of 5), educational attainment of the respondent, occupation of the respondent, current employment status of the respondent, type and duration employment of the respondent, payment received for work by the respondent, number of sons and daughters away from home, number of years the respondent lived in the current residence, religion of the respondent. This data set has been produced in the framework of the "Climate change predictions in Sub-Saharan Africa: impacts and adaptations (ClimAfrica)" project, Work Package 5 (WP5). More information on ClimAfrica project is provided in the Supplemental Information section of this metadata. This study in WP5 aimed to identify, locate and characterize groups that are vulnerable for climate change conditions in two country clusters; one in West Africa (Benin, Burkina Faso, Côte d'Ivoire, Ghana, and Togo) and one in East Africa (Sudan, South Sudan and Uganda). Data used for the study include the Demographic and Health Surveys (DHS) , the Multi Indicator Cluster Survey (MICS) and the Afrobarometer surveys for the socio-economic variables and grid level data on agro-ecological and climatic conditions.
-
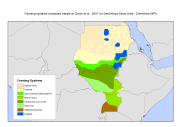
A farming system is defined as a population of individual farm systems that have broadly similar resource bases, enterprise patterns, household livelihoods and constraints, and for which related development strategies and interventions would be appropriate. Depending on the scale of the analysis, a farming system can encompass a few dozen or many millions of households. The map that is used in this exercise was presented in Dixon et al., 2001. The farming systems for Africa and their encoding are presented below: Code - Farming system 1 - Irrigated 2 - Tree crop 3 - Forest based 4 - Rice-tree crop 5 - Highland perennial 6 - Highland temperate mixed 7 - Root crop 8 - Cereal-root crop mixed 9 - Maize mixed 10 - Large commercial & smallholder 11 - Agro-pastoral millet/sorghum 12 - Pastoral 13 - Sparse (arid) 14 - Coastal artisanal fishing This dataset has been used to complement the survey data and included in the "Climate change predictions in Sub-Saharan Africa: impacts and adaptations (ClimAfrica)" project, Work Package 5 (WP5). More information on ClimAfrica project is provided in the Supplemental Information section of this metadata. This study in WP5 aimed to identify, locate and characterize groups that are vulnerable for climate change conditions in two country clusters; one in West Africa (Benin, Burkina Faso, Côte d’Ivoire, Ghana, and Togo) and one in East Africa (Sudan, South Sudan and Uganda). Data used for the study include the Demographic and Health Surveys (DHS) , the Multi Indicator Cluster Survey (MICS) and the Afrobarometer surveys for the socio-economic variables and grid level data on agro-ecological and climatic conditions.