 FAO Map Catalog
unknown
Type of resources
Available actions
Topics
Keywords
Contact for the resource
Provided by
Formats
Representation types
Update frequencies
status
Scale
-
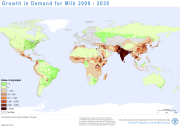
Livestock is one of the fastest-growing sectors in agriculture, potentially presenting opportunities for economic growth and poverty reduction in rural areas. Dealing with the important social, environmental and public health issues linked to sector growth will require solutions that embrace the way in which the livestock sector grows to meet the increasing demand for animal-source foods. It is then important to understand where growth in demand for livestock commodities is likely to occur, and how and where production of livestock commodities will be increased in order to meet it. Estimates of supply and demand for animal-source foods, provided by the Global Perspective Studies Unit at FAO, have been disaggregated spatially for the years 2000 and 2030. Demand for animal-source foods (beef, milk, mutton, pork, poultry meat and eggs) was mapped by estimating per-capita consumption and applying this to mapped population distributions in 2000. Population maps were produced for 2030 based on projected population growth and urbanisation rates and future estimates of per-capita demand applied to these. Similarly, livestock production maps were produced by spatially disaggregating the estimated production based on maps of the relevant livestock species. Methods and results are presented in the forthcoming FAO working paper âMapping Supply and Demand for Animal-Source Foods to 2030 (by T.P. Robinson and F. Pozzi, 2011). Grids and tabular data are distributed here by livestock product and by continent.
-
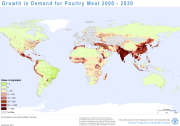
Livestock is one of the fastest-growing sectors in agriculture, potentially presenting opportunities for economic growth and poverty reduction in rural areas. Dealing with the important social, environmental and public health issues linked to sector growth will require solutions that embrace the way in which the livestock sector grows to meet the increasing demand for animal-source foods. It is then important to understand where growth in demand for livestock commodities is likely to occur, and how and where production of livestock commodities will be increased in order to meet it. Estimates of supply and demand for animal-source foods, provided by the Global Perspective Studies Unit at FAO, have been disaggregated spatially for the years 2000 and 2030. Demand for animal-source foods (beef, milk, mutton, pork, poultry meat and eggs) was mapped by estimating per-capita consumption and applying this to mapped population distributions in 2000. Population maps were produced for 2030 based on projected population growth and urbanisation rates and future estimates of per-capita demand applied to these. Similarly, livestock production maps were produced by spatially disaggregating the estimated production based on maps of the relevant livestock species. Methods and results are presented in the forthcoming FAO working paper âMapping Supply and Demand for Animal-Source Foods to 2030 (by T.P. Robinson and F. Pozzi, 2011). Grids and tabular data are distributed here by livestock product and by continent.
-
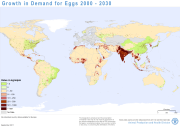

The Global Urban-Rural Catchment Areas (URCA) is a raster dataset of the 30 urban–rural continuum categories of catchment areas for cities and towns. Each rural pixel is assigned to one defined travel time category: less than one hour, one to two hours, and two to three hours travel time to one of seven urban agglomeration sizes. The agglomerations range from large cities with i) populations greater than 5 million and ii) between 1 to 5 million; intermediate cities with iii) 500,000 to 1 million and iv) 250,000 to 500,000 inhabitants; small cities with populations v) between 100,000 and 250,000 and vi) between 50,000 and 100,000; and vii) towns of between 20,000 and 50,000 people. The remaining pixels that are more than 3 hours away from any urban agglomeration of at least 20,000 people are considered as either hinterland or dispersed towns being that they are not gravitating around any urban agglomeration.
-
Content on the Climate Risk Analysis concept and purpose is needed
-

The Administrative boundaries at the level 5 dataset are part of the Global Administrative Areas (GADM) 3.6 vector dataset series which includes distinct datasets representing administrative boundaries for all countries in the world. The Administrative level 5 distinguishes sub-national administrative boundaries smaller than Communes and Municipalities and is available for France and Rwanda. GADM makes use of high spatial resolution images, and an extensive set of attributes to map administrative areas at all levels of political sub-division. Information on administrative units associated attributes includes official names in Latin and non-Latin scripts, variant names, administrative type in local an English. Please read the GADM 3.6 - Global Administrative Areas dataset series metadata for more information.
-

The Land Cover Database of the Islamic Republic of Afghanistan has been created as part of the land cover mapping component of the project on “Strengthening Agricultural Economics, Market Information and Statistics Services” formulated upon request from the Government of the Islamic Republic of Afghanistan and funded by the European Commission. The Food and Agriculture Organization of the United Nations (FAO) provided technical assistance as the executing agency in close cooperation with all parties. The Land Cover database provides information on land cover distribution. It has been created using the FAO/GLCN methodology and tools. The main data sources include satellite imagery from SPOT-4 (2009-2011) and Global Land Survey (GLS-2011) Landsat satellites, high resolution satellite imagery and very hisgh resolution aerial photographs, ancillary data. The national legend was prepared using the Land Cover Classification System (LCCS). FAO’s Mapping Device Change Analysis Tools (MADCAT) software was used to create the database using object based classification methodology. The full resolution land cover legend has 25 classes. As result, more that 500,000 polygons were delineated. To refine the interpretation, high resolution images from various sources are used. The 25 original land cover classes were aggregated into 11 generalized and self-explicative classes as following: Built-Up (URB); Fruit Trees (AGT); Vineyard (AGV); Irrigated Agricultural Land (AGI); Rainfed Agricultural Land (AGR); Forest and Shrubs (NFS); Rangeland (NHS); Barren land (BRS); Sand Cover (BSD); Water Body and Marshland (WAT); Permanent Snow (SNW). The database is distributed in shapefile format in UTM zone 42 North WGS-84 datum. Each shapefile is included in a geodatabase. The tabular attributes contains 4 fields: -AGGCODE is the aggregated class name; -LCCSPERC is the percentage share of each code in the land cover unit as following:100 means that there is only one single land cover class present; 60/40 means that this is a mixed unit land cover class with two classes; the distribution of the land cover classes inside the land cover unit is 60 percent for the first class and 40 percent for the second class; 40/30/30 means that this is a mixed unit land cover class with three classes; the distribution of the land cover classes inside the land cover unit is 40 percent for the first class, 30 percent for the second class and 30 percent for the third class; -DIST_NAME is the second administrative unit level (District level) name based on the administrative layer provided by the Counterpart Agency in Afghanistan; -PROV_NAME is the first administrative unit level (Provincial level) name based on the administrative layer provided by the Counterpart Agency in Afghanistan.
-
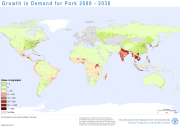
Livestock is one of the fastest-growing sectors in agriculture, potentially presenting opportunities for economic growth and poverty reduction in rural areas. Dealing with the important social, environmental and public health issues linked to sector growth will require solutions that embrace the way in which the livestock sector grows to meet the increasing demand for animal-source foods. It is then important to understand where growth in demand for livestock commodities is likely to occur, and how and where production of livestock commodities will be increased in order to meet it. Estimates of supply and demand for animal-source foods, provided by the Global Perspective Studies Unit at FAO, have been disaggregated spatially for the years 2000 and 2030. Demand for animal-source foods (beef, milk, mutton, pork, poultry meat and eggs) was mapped by estimating per-capita consumption and applying this to mapped population distributions in 2000. Population maps were produced for 2030 based on projected population growth and urbanisation rates and future estimates of per-capita demand applied to these. Similarly, livestock production maps were produced by spatially disaggregating the estimated production based on maps of the relevant livestock species. Methods and results are presented in the forthcoming FAO working paper âMapping Supply and Demand for Animal-Source Foods to 2030 (by T.P. Robinson and F. Pozzi, 2011). Grids and tabular data are distributed here by livestock product and by continent.
-
The Administrative boundaries at the level 4 dataset are part of the Global Administrative Areas (GADM) 3.6 vector dataset series which includes distinct datasets representing administrative boundaries for all countries in the world. The Administrative level 4 distinguishes sub-national administrative boundaries smaller than Communes and Municipalities and is available for 20 countries. GADM makes use of high spatial resolution images, and an extensive set of attributes to map administrative areas at all levels of political sub-division. Information on administrative units associated attributes includes official names in Latin and non-Latin scripts, variant names, administrative type in local an English. Please read the GADM 3.6 - Global Administrative Areas dataset series metadata for more information.
-
Livestock is one of the fastest-growing sectors in agriculture, potentially presenting opportunities for economic growth and poverty reduction in rural areas. Dealing with the important social, environmental and public health issues linked to sector growth will require solutions that embrace the way in which the livestock sector grows to meet the increasing demand for animal-source foods. It is then important to understand where growth in demand for livestock commodities is likely to occur, and how and where production of livestock commodities will be increased in order to meet it. Estimates of supply and demand for animal-source foods, provided by the Global Perspective Studies Unit at FAO, have been disaggregated spatially for the years 2000 and 2030. Demand for animal-source foods (beef, milk, mutton, pork, poultry meat and eggs) was mapped by estimating per-capita consumption and applying this to mapped population distributions in 2000. Population maps were produced for 2030 based on projected population growth and urbanisation rates and future estimates of per-capita demand applied to these. Similarly, livestock production maps were produced by spatially disaggregating the estimated production based on maps of the relevant livestock species. Methods and results are presented in the forthcoming FAO working paper âMapping Supply and Demand for Animal-Source Foods to 2030 (by T.P. Robinson and F. Pozzi, 2011). Grids and tabular data are distributed here by livestock product and by continent.