 FAO Map Catalog
daily
Type of resources
Available actions
Topics
Keywords
Contact for the resource
Provided by
Years
Formats
Representation types
Update frequencies
status
Resolution
-
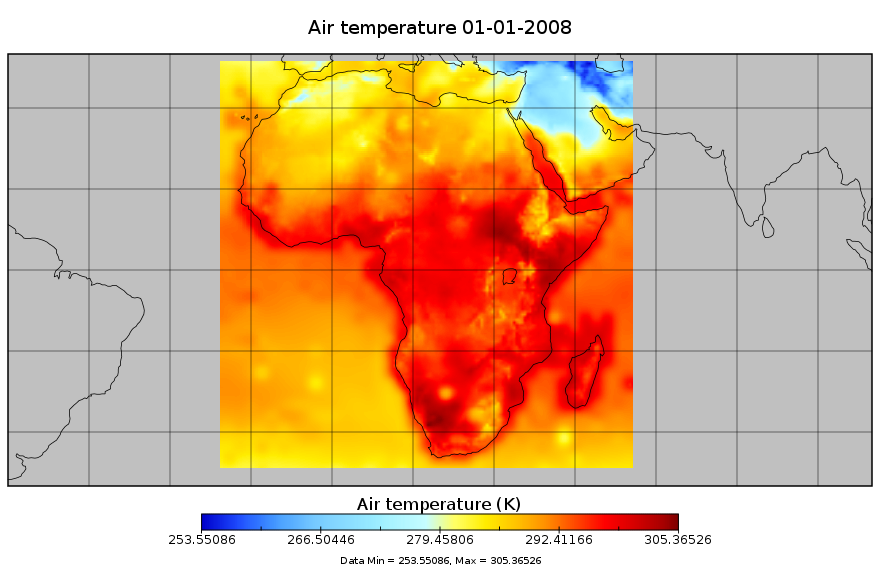
Bias-corrected and downscaled future climate meterological forcing data for Africa, for the period 1948-2099. This dataset is derived from the Global Meteorological Forcing Dataset for Land Surface Modeling, produced by the Princeton University [Department of Civil and Environmental Engineering]. The source data is a 150-yr (1948-2099) dataset of meteorological forcings for driving land surface models and other land modeling schemes. It is derived by bias correcting and downscaling WCRP CMIP3 climate model data for the 20th century and 21st century future climate projections. The dataset is bias-corrected and downscaled using the newly developed equidistant quantile matching method (Li et al., 2010) which better represents changes in the full distribution (not just the mean change). In addition to precipitation and temperature, radiation, humidity, pressure and windspeed are also downscaled. The downsclaing is based on the observational based global forcing dataset of Sheffield et al. (2006) also available from this website. The dataset is currently available at 1.0 degree, 3-hourly resolution globally for 1948-2008. Experimental versions include a 1901-2008 version, real-time updates, higher resolution versions at 0.25deg and 0.5deg and future climate projections based on bias-corrected climate model output. The data are currently available for one climate model (NCAR-PCM1) for the 20th century historical forcing (20C3M; 1948-2000) and one future climate scenario (SRES A2; 2001-2099). This work was supported by NSF Project 0629471 "Collaborative research: Understanding change in the climate and hydrology of the Arctic land region: Synthesizing the results of the ARCSS Fresh Water Initiative Projects". Variables description Tair: 2 m air temperature (K) PSurf: 2 m surface pressure (Pa) Qair: specific humidity (kg/kg) Wind: 10m wind speed (m/s) Precip: precipitation (mm) LWdown: Downwards long-wave radiation flux (W/m-2) LWnet: Net short-wave radiation flux (W/m-2) SWdown: Downwards short-wave radiation flux (average) (W/m-2) This data set has been produced for driving land surface models and other land modeling schemes, in the framework of the "Climate change predictions in Sub-Saharan Africa: impacts and adaptations (ClimAfrica)" project, Work Package 1 (WP1).
-

Total volume of liquid water (mm3) precipitated over the period 00h-24h local time per unit of area (mm2), per day. Unit: mm day-1. The Precipitation flux variable is part of the Agrometeorological indicators dataset produced by the European Centre for Medium-Range Weather Forecasts (ECMWF) through the Copernicus Climate Change Service (C3S). The Agrometeorological indicators dataset provides daily surface meteorological data for the period from 1979 to present as input for agriculture and agro-ecological studies. This dataset is based on the hourly ECMWF ERA5 data at surface level and is referred to as AgERA5. References: https://doi.org/10.24381/cds.6c68c9bb The Copernicus Climate Change Service (C3S) aims to combine observations of the climate system with the latest science to develop authoritative, quality-assured information about the past, current and future states of the climate in Europe and worldwide. ECMWF operates the Copernicus Climate Change Service on behalf of the European Union and will bring together expertise from across Europe to deliver the service.
-
Bias Correction of ERA-interim meteorological forcing dataset for Africa, based on Piani et al. (2010) for the period 1979 - 2011. Variables description Tair: air temperature (K) Tmin: minimum air temperature (K) Tmax: maximum air temperature (K) PSurf: surface pressure (Pa) Qmean: specific humidity (kg/kg) Wind: wind speed (m/s) Precip: precipitation (mm) LWdown: Downwards long-wave radiation flux (W/m-2) SWdown: Downwards short-wave radiation flux (W/m-2). This data set has been produced in the framework of the "Climate change predictions in Sub-Saharan Africa: impacts and adaptations (ClimAfrica)" project, Work Package 1 (WP1). WP1 (Past climate variability) aimed to provide consolidated data to other WPs in ClimAfrica, and to analyze the interactions between climate variability, water availability and ecosystem productivity of Sub-Saharan Africa. Various data streams that diagnose the variability of the climate, in particular the water cycle, and the productivity of ecosystems in the past decades, have been collected, analyzed and synthesized. The data streams range from ground-based observations and satellite remote sensing to model simulations. More information on ClimAfrica project is provided in the Supplemental Information section of this metadata.
-

Relative humidity at 15h (local time) at a height of 2 metres above the surface. This variable describes the amount of water vapour present in air expressed as a percentage of the amount needed for saturation at the same temperature. Unit: %. The Relative humidity variable is part of the Agrometeorological indicators dataset produced by the European Centre for Medium-Range Weather Forecasts (ECMWF) through the Copernicus Climate Change Service (C3S). The Agrometeorological indicators dataset provides daily surface meteorological data for the period from 1979 to present as input for agriculture and agro-ecological studies. This dataset is based on the hourly ECMWF ERA5 data at surface level and is referred to as AgERA5. References: https://doi.org/10.24381/cds.6c68c9bb The Copernicus Climate Change Service (C3S) aims to combine observations of the climate system with the latest science to develop authoritative, quality-assured information about the past, current and future states of the climate in Europe and worldwide. ECMWF operates the Copernicus Climate Change Service on behalf of the European Union and will bring together expertise from across Europe to deliver the service.
-

Mean wind speed at a height of 10 metres above the surface over the period 00h-24h local time. Unit: m s-1. The Wind Speed variable is part of the Agrometeorological indicators dataset produced by the European Centre for Medium-Range Weather Forecasts (ECMWF) through the Copernicus Climate Change Service (C3S). The Agrometeorological indicators dataset provides daily surface meteorological data for the period from 1979 to present as input for agriculture and agro-ecological studies. This dataset is based on the hourly ECMWF ERA5 data at surface level and is referred to as AgERA5. References: https://doi.org/10.24381/cds.6c68c9bb The Copernicus Climate Change Service (C3S) aims to combine observations of the climate system with the latest science to develop authoritative, quality-assured information about the past, current and future states of the climate in Europe and worldwide. ECMWF operates the Copernicus Climate Change Service on behalf of the European Union and will bring together expertise from across Europe to deliver the service.
-

Maximum air temperature calculated at a height of 2 metres above the surface. Unit: K. The Maximum air temperature variable is part of the Agrometeorological indicators dataset produced by the European Centre for Medium-Range Weather Forecasts (ECMWF) through the Copernicus Climate Change Service (C3S). The Agrometeorological indicators dataset provides daily surface meteorological data for the period from 1979 to present as input for agriculture and agro-ecological studies. This dataset is based on the hourly ECMWF ERA5 data at surface level and is referred to as AgERA5. References: https://doi.org/10.24381/cds.6c68c9bb The Copernicus Climate Change Service (C3S) aims to combine observations of the climate system with the latest science to develop authoritative, quality-assured information about the past, current and future states of the climate in Europe and worldwide. ECMWF operates the Copernicus Climate Change Service on behalf of the European Union and will bring together expertise from across Europe to deliver the service.
-

Relative humidity at 18h (local time) at a height of 2 metres above the surface. This variable describes the amount of water vapour present in air expressed as a percentage of the amount needed for saturation at the same temperature. Unit: %. The Relative humidity variable is part of the Agrometeorological indicators dataset produced by the European Centre for Medium-Range Weather Forecasts (ECMWF) through the Copernicus Climate Change Service (C3S). The Agrometeorological indicators dataset provides daily surface meteorological data for the period from 1979 to present as input for agriculture and agro-ecological studies. This dataset is based on the hourly ECMWF ERA5 data at surface level and is referred to as AgERA5. References: https://doi.org/10.24381/cds.6c68c9bb The Copernicus Climate Change Service (C3S) aims to combine observations of the climate system with the latest science to develop authoritative, quality-assured information about the past, current and future states of the climate in Europe and worldwide. ECMWF operates the Copernicus Climate Change Service on behalf of the European Union and will bring together expertise from across Europe to deliver the service.
-

Relative humidity at 12h (local time) at a height of 2 metres above the surface. This variable describes the amount of water vapour present in air expressed as a percentage of the amount needed for saturation at the same temperature. Unit: %. The Relative humidity variable is part of the Agrometeorological indicators dataset produced by the European Centre for Medium-Range Weather Forecasts (ECMWF) through the Copernicus Climate Change Service (C3S). The Agrometeorological indicators dataset provides daily surface meteorological data for the period from 1979 to present as input for agriculture and agro-ecological studies. This dataset is based on the hourly ECMWF ERA5 data at surface level and is referred to as AgERA5. References: https://doi.org/10.24381/cds.6c68c9bb The Copernicus Climate Change Service (C3S) aims to combine observations of the climate system with the latest science to develop authoritative, quality-assured information about the past, current and future states of the climate in Europe and worldwide. ECMWF operates the Copernicus Climate Change Service on behalf of the European Union and will bring together expertise from across Europe to deliver the service.
-
WATCH Forcing Data 20th Century. A meteorological forcing dataset (based on ERA-40) for land surface and hydrological models (1901-2001). Data generated in 2 tranches with slightly different methodology: 1901-1957 and 1958-2001. Five variables are at 6 hourly resolution and five variables are at 3 hourly resolution: Tair_WFD_ - 2m Air temperature (K) Tmin_WFD_ - 2m Minimum air temperature (K) Tmax_WFD_ - 2m Maximum air temperature (K) PSurf_WFD_ - 10m Surface pressure (Pa) Qair_WFD_ - 2m Specific umidity (kg/kg) Wind_WFD_ - 10m Wind speed (m/s) LWdown_WFD_ - Downwards long-wave radiation flux (W/m-2) SWdown_WFD_ - Downwards short-wave radiation flux (W/m-2) Rainf_WFD_GPCC_ - Rainfall rate GPCC bias corrected and undercatch corrected Snowf_WFD_GPCC_ - Snowfall rate GPCC bias corrected and undercatch corrected (kg/m-2/s) Rainf_WFD_CRU_ - Rainfall rate CRU bias corrected and undercatch corrected (kg/m-2/s) Snowf_WFD_CRU_ - Snowfall rate CRU bias corrected and undercatch corrected (kg/m-2/s). This data set has been produced in the framework of the "Climate change predictions in Sub-Saharan Africa: impacts and adaptations (ClimAfrica)" project, Work Package 1 (WP1). WP1 (Past climate variability) aimed to provide consolidated data to other WPs in ClimAfrica, and to analyze the interactions between climate variability, water availability and ecosystem productivity of Sub-Saharan Africa. Various data streams that diagnose the variability of the climate, in particular the water cycle, and the productivity of ecosystems in the past decades, have been collected, analyzed and synthesized. The data streams range from ground-based observations and satellite remote sensing to model simulations. More information on ClimAfrica project is provided in the Supplemental Information section of this metadata.
-

Relative humidity at 09h (local time) at a height of 2 metres above the surface. This variable describes the amount of water vapour present in air expressed as a percentage of the amount needed for saturation at the same temperature. Unit: %. The Relative humidity variable is part of the Agrometeorological indicators dataset produced by the European Centre for Medium-Range Weather Forecasts (ECMWF) through the Copernicus Climate Change Service (C3S). The Agrometeorological indicators dataset provides daily surface meteorological data for the period from 1979 to present as input for agriculture and agro-ecological studies. This dataset is based on the hourly ECMWF ERA5 data at surface level and is referred to as AgERA5. References: https://doi.org/10.24381/cds.6c68c9bb The Copernicus Climate Change Service (C3S) aims to combine observations of the climate system with the latest science to develop authoritative, quality-assured information about the past, current and future states of the climate in Europe and worldwide. ECMWF operates the Copernicus Climate Change Service on behalf of the European Union and will bring together expertise from across Europe to deliver the service.