 FAO Map Catalog
water
Type of resources
Available actions
Topics
Keywords
Contact for the resource
Provided by
Years
Formats
Representation types
Update frequencies
status
Scale
Resolution
-
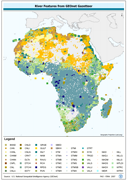
Seamless and robust derivative of SWB, Double-Lined River, and Inshore Island Features from SRTM-SWBD data tiles. Data source: NASA Surface Water Body Database. Highest resolution water body and coastal mask of Africa
-
GNS_RIV: GNS/GeoNet named river confluence & outflow locations Value-added derivative of source w/non-diacritical names of river confluence's. The GNS_RIV shapefile data layer is comprised of 138700 derivative point gazetteer features derived based on 1:250 000 data originally from GEOnet. The layer provides nominal analytical/mapping at 1:250 000. Data processing is complete globally, this is an African subset. Acronyms and Abbreviations: GNS/GeoNet - NIMA?s Geographic Names Server Gazetteer of Named Locations; NIMA - U.S. National Imagery & Mapping Agency, formerly the U.S. Defense Mapping Agency (DMA).
-
WRIBASIN: Watersheds of the World published by the World Resources Institute, A cleaned version of this watershed delineation enhanced to include WRI's original publication attributes. The WRIBASIN shapefile data layer is comprised of 254 derivative vector major river basins features derived based on ~250 000 cell data originally from WRI-Rutgers. Data processing is complete globally, this is an African subset.
-
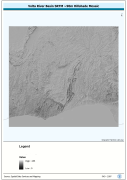
Seamless nominal 90 metre DEM (Digital Elevation Model) of Volta Megabasin. The VOLTA_HSHD image data layer is comprised of 13201x14401 derivative raster hillshade features derived based on 0.000833_ data originally from SRTM 3as v.2.
-
A dissolved version of the AVec_DBC data using ArcView to ensure any summary SWB or watershed statistical data are not double counted. The VMAP_SUM_AD2 shapefile data layer is comprised of 699 derivative polygon surface water bodies by admin units features derived based on 1:1 000 000 data originally from VMap0. The layer provides nominal analytical/mapping at 1:1 000 000. Acronyms and Abbreviations: SWB - Surface Waterbody.
-
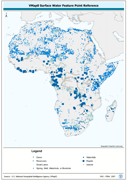
Robust derivative of VMap0 - Ed5 data layers harmonized with DCW dams, lakes, waterholes, wells and other SWBs based on the VMAP0-MP and DCW-DN/DSPNT sources. The DNIW_PNT shapefile data layer is comprised of 19230 derivative vector surface water bodies features derived based on 1:1 000 000 data originally from VMap0/DCW. The layer provides nominal analytical/mapping at 1:1 000 000. Seamlessly complete globally, with consolidation-harmonization @ ~70%, this Africa subset at final. Acronyms and Abbreviations: VMap0 - Vector Map for Level 0; DCW - Digital Chart of the World; SWBs - Surface Waterbodies, DNNET - Drainage Network layer; LCPOLY - Land Cover layer.
-
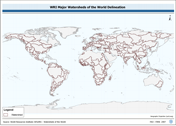
WRIBASIN: Watersheds of the World published by the World Resources Institute, a cleaned version of this watershed delineation enhanced to include WRI's original publication attributes. The WRIBASIN shapefile data layer is comprised of 254 derivative vector major river basins features derived based on ~250 000 cell data originally from WRI-Rutgers. Data processing is complete globally, this is an African subset. Acronyms and Abbreviations: WRI - World Resources Institute.
-
A dissolved version of the AVec_DBC data using ArcView to ensure any summary SWB or watershed statistical data are not double counted. The VMAP_SUM_AD1 shapefile data layer is comprised of 64 derivative polygon surface water bodies by admin units features derived based on 1:1 000 000 data originally from VMap0. The layer provides nominal analytical/mapping at 1:1 000 000. Acronyms and Abbreviations: VMap0 - Vector Map for Level 0; SWB - Surface Water Body.
-
Grid cell-specific runoff, including surface runoff, lateral runoff, and percolation water. Inflow from neighboring cells is not included. Unit: mm Climate Input: MIROC5, CanESM, GFDL Downscaling method/bias correction: RCA3, QMBC, SOMD CO2 scenarios: B1 transient CO2, B2 constant CO2 at 1960 level (316.27ppm) Land use: land use is kept constant at the year 2000 distribution. Temporal Extent: 1961-2099 (monthly resolution) Spatial Extent: Africa Spatial Resolution: 0.5° grid cell This data set has been produced in the framework of the "Climate change predictions in Sub-Saharan Africa: impacts and adaptations (ClimAfrica)" project, Work Package 3 (WP3). WP3 aims at quantifying the sensitivity of vegetation productivity and water resources to seasonal, inter-annual and decadal variability in weather and climate, using impact models on agriculture and water. The available models in combination with developed datasets of land use and climate from WP2 were used to simulate crop yield and water resources. Simulations using short-term scenarios of future climate change (5-10 years) were used to identify regional differences in the climate sensitivity of crop production etc. Scenarios for the African agricultural/pastoral sectors were also made using longer model runs. Finally, tradeoffs and areas of risk and vulnerability were identified in relation to: - Water-related hazards; - Agricultural and pastoral performance; - Soil degradation. More information on ClimAfrica project is provided in the Supplemental Information section of this metadata.
-
The map is compiled for the SOLAW Report: "Sources of water for agriculture". Data are available from AQUASTAT - programme of the Land and Water Division of the Food and Agriculture Organization of the United Nations. Perhaps the most widespread indicator of water scarcity at country level that can be found in literature is per capita availability of average renewable water resources, using threshold values of 500, 1 000 and 1 700 m3/person per year (Falkenmark and Widstrand, 1992; UN-Water, 2006b). Under this system countries or regions are considered to be facing absolute water scarcity if water availability is < 500 m3 per capita per year, chronic water shortage if water availability is between 500 and 1 000 m3, regular water stress between 1 000 and 1 700 m3, and occasional stress or local stress can occur also at levels above 1 700 m3. This relatively simple approach to measuring water scarcity was primarily based on estimates of the number of people who can reasonably live with a certain unit of water resources (Falkenmark, 1984). This indicator is widely used because it can be easily calculated for every country in the world and for every year, based on long-term average annual water resources data (FAO, 2010a) and available population data (UN, 2009).