 FAO Map Catalog
rural population
Type of resources
Available actions
Topics
Keywords
Contact for the resource
Provided by
Years
Formats
Representation types
Update frequencies
status
Resolution
-
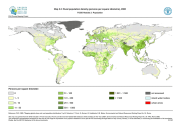
The FGGD rural population density map is a global raster datalayer with a resolution of 5 arc-minutes. Each pixel classified as rural by the urban area boundaries map contains the number of persons per square kilometre, aggregated from the 30 arc-second datalayer. All remaining pixels contain no data. The method used by FAO to generate this datalayer is described in FAO, 2005, Mapping global urban and rural population distributions, by M. Salvatore, et. al.
-
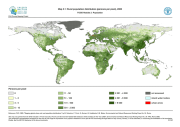
The FGGD high resolution rural population distribution map is a global raster datalayer with a resolution of 30 arc-seconds. Each pixel classified as rural by the urban area boundaries map contains a numeric count of persons in the land area represented by the pixel. All remaining pixels contain no data. The method used by FAO to generate this datalayer is described in FAO, 2006, Mapping global urban and rural population distributions, by M. Salvatore, et. al.
-
The FGGD rural population distribution map is a global raster datalayer with a resolution of 5 arc-minutes. Each pixel classified as rural by the urban area boundaries map contains a numeric count of persons in the land area represented by the pixel, aggregated from the 30 arc-second datalayer. All remaining pixels contain no data. The method used by FAO to generate this datalayer is described in FAO, 2005, Mapping global urban and rural population distributions, by M. Salvatore, et. al.
-
The FGGD high resolution rural population density map is a global raster datalayer with a resolution of 30 arc-seconds. Each pixel classified as rural by the urban area boundaries map contains the number of persons per square kilometre. All remaining pixels contain no data. The method used by FAO to generate this datalayer is described in FAO, 2006, Mapping global urban and rural population distributions, by M. Salvatore, et. al.
-

The “rurality index” represents the level of dependence, thus fragility, of a certain region to agriculture and rural means of livelihood in 2010. A population strongly dependent from agriculture is subject to suffer larger consequences from agriculture productivity drop due to climatic alteration than a population less dependent by rural livelihood means. The index results from the first cluster of the Principal Component Analysis preformed among 14 potential variables. The analysis identify four dominant variables, namely “rural population density”, “dietary supply”, “dependency ratio” and “agriculture share GDP”, assigning a weight of 0.22 to the “rural population density” and 0.26 to the other three variables. Before to perform the analysis the variable “rural population density” was log transformed to shorten the extreme variation and then with the other variables were score-standardized (converted to distribution with average of 0 and standard deviation of 1; “dietary supply” with inverse method) in order to be comparable. The 5 arc-minutes grid “rural population density” of 2000 was collected from FAO GeoNetwork, sampled at 0.5 arc-minutes and then the values were adjusted in order to have national rural population totals equal to the 2010 values reported by the World Urbanization Prospects, the 2011 Revision. The 0.5 arc-minutes grid “dependency ratio” was calculated from the 2010 age distribution population for Africa produced by Worldpop Project computing the number of people with less than 15 years old or older than 65 years old per 100 people. The values were adjusted to the country total reported by the UN Population and Demographic Office estimation (World Population Prospect - the 2012 Revision). The country based value for “agriculture share GDP” and “dietary supply” were collected from World Bank and FAO statistics. The values reported are the average of the period 2008-2012. Tabular data were linked by country to the national boundaries shapefile (FAO/GAUL) and then converted into raster format (resolution 0.5 arc-minute). Rural population, or population with large number of dependent people are more fragile (i.e. sensible) to climatic stress, due to impact on food production. Similarly, high reliance on agriculture’s contribution to national GDP, makes country more susceptible to climate risk. Finally, populations with scarce dietary supply are more sensitive to climate impact on food production, because already affected by food supply concerns. This dataset has been produced in the framework of the “Climate change predictions in Sub-Saharan Africa: impacts and adaptations (ClimAfrica)” project, Work Package 4 (WP4). More information on ClimAfrica project is provided in the Supplemental Information section of this metadata.
-

SOW-VU "Africa in maps" database updated from van Wesenbeeck and Merbis, 2012. These include population maps (total, urban, rural, refugees/IDPs), food aid distribution, and estimates of total production measured in mt cereal equivalents per capita. This data set have been used to complement the survey data and included in the 'Climate change predictions in Sub-Saharan Africa: impacts and adaptations (ClimAfrica)" project, Work Package 5 (WP5). WP5 deals with economic assessment of agriculture and water sector based on a Computable General Equilibrium analysis (ICES) to produce the "inaction" and the adaptation scenarios, for direct climate change impacts on agricultural activity and on the direct cost and effectiveness of adaptation strategies. The main advantage of this investigation approach is to depict the economy as a system where goods and factor markets interacts domestically and internationally. Price effects, competitiveness effects, and demand & supply adjustments triggered by impacts on the agricultural sector can thus be properly captured. Moreover, the spatially explicit and dynamic economic modeling of vulnerability will have to accommodate bio-physical vulnerabilities. More information on ClimAfrica project's scope and objectives is provided in the Supplemental Information section of this metadata.
-
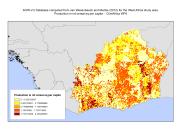
SOW-VU "Africa in maps" database updated from van Wesenbeeck and Merbis, 2012. These include population maps (total, urban, rural, refugees/IDPs), food aid distribution, and estimates of total production measured in mt cereal equivalents per capita. This data set have been used to complement the survey data and included in the "Climate change predictions in Sub-Saharan Africa: impacts and adaptations (ClimAfrica)" project, Work Package 5 (WP5). More information on ClimAfrica project is provided in the Supplemental Information section of this metadata. The study in WP5 aimed to identify, locate and characterize groups that are vulnerable for climate change conditions in two country clusters; one in West Africa (Benin, Burkina Faso, Côte d'Ivoire, Ghana, and Togo) and one in East Africa (Sudan, South Sudan and Uganda). Data used for the study include the Demographic and Health Surveys (DHS) , the Multi Indicator Cluster Survey (MICS) and the Afrobarometer surveys for the socio-economic variables and grid level data on agro-ecological and climatic conditions.