 FAO Map Catalog
remote sensing
Type of resources
Available actions
Topics
Keywords
Contact for the resource
Provided by
Years
Formats
Representation types
Update frequencies
status
Resolution
-

Digital elevation model cover: areas located between 10 meters below and above sea level. ETOPO5 was generated from a digital data base of land and sea- floor elevations on a 5-minute latitude/longitude grid.
-

The Dynamic Land Cover map at 100 m resolution (CGLS-LC100) is a new product in the portfolio of the CGLS and delivers a global land cover map at 100 m spatial resolution. The CGLS Land Cover product provides a primary land cover scheme. Next to these discrete classes, the product also includes continuous field layers for all basic land cover classes that provide proportional estimates for vegetation/ground cover for the land cover types. This continuous classification scheme may depict areas of heterogeneous land cover better than the standard classification scheme and, as such, can be tailored for application use (e.g. forest monitoring, crop monitoring, biodiversity and conservation, monitoring environment and security in Africa, climate modelling, etc.). These consistent Land Cover maps (v3.0.1) are provided for the period 2015-2019 over the entire Globe, derived from the PROBA-V 100 m time-series, a database of high quality land cover training sites and several ancillary datasets, reaching an accuracy of 80% at Level1 over al years. It is planned to provide yearly updates from 2020 through the use of a Sentinel time-series.
-
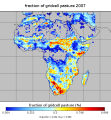
Dataset with information on fractions of different crop types /CFTs at different land cover fractions based on the Synergetic Land Cover Product (SYNMAP), at global scale and for the African continent. SYNMAP is an improved global land cover product with 48 classes at 1-km spatial resolution, reflecting global land covers around year 2000. It fuses different global land cover products, including, Global Land Cover Characterization Database (GLCC), GLC2000, and the 2001 MODIS land cover product, based on fuzzy agreement, which highlights individual strengths and weaknesses of mapping approaches. The overall advantage of the SYNMAP legend is that all classes are properly defined in terms of plant functional types mixtures, which can be remotely sensed and include the definitions of leaf type and longevity for each class with a tree component. This data set has been produced in the framework of the "Climate change predictions in Sub-Saharan Africa: impacts and adaptations (ClimAfrica)" project, Work Package 1 (WP1). WP1 (Past climate variability) aimed to provide consolidated data to other WPs in ClimAfrica, and to analyze the interactions between climate variability, water availability and ecosystem productivity of Sub-Saharan Africa. Various data streams that diagnose the variability of the climate, in particular the water cycle, and the productivity of ecosystems in the past decades, have been collected, analyzed and synthesized. The data streams range from ground-based observations and satellite remote sensing to model simulations. More information on ClimAfrica project is provided in the Supplemental Information section of this metadata.
-

Tentative abstract: This dataset assesses the exposure of the project area to the hazards based on the available information related to the richness of species or ecosystems. Source:
-

The Dynamic Land Cover map at 100 m resolution (CGLS-LC100) is a new product in the portfolio of the CGLS and delivers a global land cover map at 100 m spatial resolution. The CGLS Land Cover product provides a primary land cover scheme. Next to these discrete classes, the product also includes continuous field layers for all basic land cover classes that provide proportional estimates for vegetation/ground cover for the land cover types. This continuous classification scheme may depict areas of heterogeneous land cover better than the standard classification scheme and, as such, can be tailored for application use (e.g. forest monitoring, crop monitoring, biodiversity and conservation, monitoring environment and security in Africa, climate modelling, etc.). These consistent Land Cover maps (v3.0.1) are provided for the period 2015-2019 over the entire Globe, derived from the PROBA-V 100 m time-series, a database of high quality land cover training sites and several ancillary datasets, reaching an accuracy of 80% at Level1 over al years. It is planned to provide yearly updates from 2020 through the use of a Sentinel time-series.
-

The Inter-Sectoral Impact Model Intercomparison Project (ISIMIP) provides a framework for the collation of a consistent set of climate impact data across sectors and scales. It also provides a unique opportunity for considering interactions between climate change impacts across sectors through consistent scenarios. In this case, fixed-year direct human influences (e.g. land use, nitrogen deposition and fertilizer input, fishing effort).
-

Cropwatch is China's leading agricultural monitoring system, using remote sensing and ground observation data to assess crop growth, yield and related information on national and global scales. The Cropwatch scientific team is affiliated to the Aerospace Information Research Institute (AIR) under the Chinese Academy of Sciences (CAS) since 1998. The CropWatch Cloud (http://cloud.cropwatch.com.cn) is a crop-monitoring platform developed to give users access to recent Earth observation data and innovative crop monitoring technology . The open and shared cloud-based agricultural production information services (APIS) reduces the food market volatility, in line with the community of shared future for mankind. CropWatch Cloud also upgrades current satellite data downloading to real-time processing and analyses. CropWatch Cloud provides an open and customizable APIS that stakeholders over the world can calibrate, localize, customize and automatically generate agro-climatic and agronomic indicators according to their own specific requirements (area, phenology, and crop) in areas of their interest. Taking advantages of cloud storage and cloud computing capacity, developing countries and stakeholders over the world can independently carry out crop monitoring and make their own analyses, at various scales from subnational to global, in areas of their interest on the CropWatch Cloud, without additional investments on hardware and software, which are the main constrains that prevent developing countries from building up their crop monitoring capacity. CropWatch Cloud provides real-time or near real-time APIS and food security early warning through releasing quarterly CropWatch Bulletins including information on agro-climatic situations, natural disasters, crop conditions, crop yield and production at global, regional, national and sub-national levels. CropWatch Cloud allows stakeholders to carry out collaborative information analyses to improve the credibility and transparency of agricultural production information, which is essential for ironing the speculations on the world food market. CropWatch Bulletins have been downloaded by stakeholders from more than 160 countries and regions around the world and the CropWatch Cloud platform recognized as a valuable tool for supporting developing countries in the implementation of the sustainable development goals (SDGs), in particular SDGs 2 - Zero Hunger.
-

This dataset shows the global distribution of mangrove forests, derived from earth observation satellite imagery. The dataset was created using Global Land Survey (GLS) data and the Landsat archive. Approximately 1,000 Landsat scenes were interpreted using hybrid supervised and unsupervised digital image classification techniques. See Giri et al. (2011) for full details.