 FAO Map Catalog
rainfall
Type of resources
Available actions
Topics
Keywords
Contact for the resource
Provided by
Years
Formats
Representation types
Update frequencies
status
Resolution
-
This map is part of a series of global climate images produced by the Agrometeorology Group and based on data for mean monthly values of temperature, precipitation and cloudiness prepared in 1991 by R. Leemans and W. Cramer and published by the International Institute for Applied Systems Analysis (IIASA). For each of the weather stations used data have been assembled over a long time period - usually between 1961 and 1990 - and then averaged. Annual totals for rainfall were derived from the monthly values.
-

Grid of estimated aridity with a spatial resolution of 10 arc minutes. This dataset represents average yearly precipitation divided by average yearly potential evapotranspiration, an aridity index defined by the United Nations Environmental Programme (UNEP). The classification of the aridity index is: - Classification Aridity Index Global land area - Hyperarid AI < 0.05 - 7.5% of the global land area - Arid 0.05 < AI < 0.20 - 12.1% of the global land area - Semi-arid 0.20 < AI < 0.50 - 17.7% of the global land area - Dry subhumid 0.50 < AI < 0.65 - 9.9% of the global land area
-
Grid with average Wet Day Frequency (rain days per month) for the period 1961-1990. This dataset is constructed from observations, backed with synthetic data derived from precipitation. Source: New, M., Lister, D., Hulme, M. and Makin, I., 2002: A high-resolution data set of surface climate over global land areas. Climate Research 21:1-25
-

Grids with monthly values of coefficient of variation of precipitation for the period 1961-1990, at 5 arc min. Based on: New, M., Lister, D., Hulme, M. and Makin, I., 2002: A high-resolution data set of surface climate over global land areas. Climate Research 21:1-25
-
Grid with estimated yearly precipitation with a spatial resolution of 10 arc minutes. The dataset contains average values for global land areas, excluding Antarctica, for the period 1961-1990. The dataset has been prepared according to the FAO Penman - Monteith method with limited climatic data as described in FAO Irrigation and Drainage Paper 56. The dataset consists one ASCII-grid with yearly data in mm/year. ASCII-grids with mean monthly data in mm/day * 10 are also available as described in the associated resources of this metadata.
-
Grid with estimated precipitation per month with a spatial resolution of 10 arc minutes. This dataset has been constructed from 27 075 stations with 1961-1990 climatological normals. The dataset consists of 12 ASCII-grids with mean monthly data in mm/day * 10, and one ASCII-grid with yearly data in mm/year. In addition, 12 ASCII-grid with monthly values at 5 arc minutes resolution are made available as input data for a global water balance model (GlobWat).
-
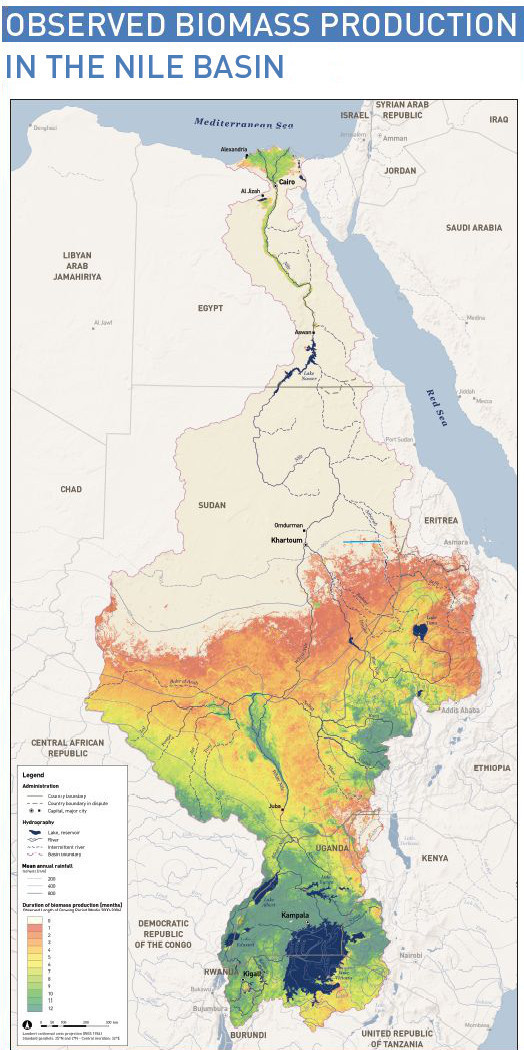
This map shows the spatial distribution of observed biomass production in the Nile Basin. It also relates annual biomass production to the irrigation volumes withdrawn from the Nile and to total annual rainfall. Biomass production is calculated monthly using the Normalized Difference Vegetation Index (NDVI). The base data are obtained from the orbiting MODIS Terra satellite sensor for the period 2000 to 2004. For all Nile countries annual rain volumes and biomass production are calculated and represented by proportional circles, which are drawn to the scale of the map. The green area represents total vegetation growth under rainfall while the blue area is the amount of biomass from stream flow. As can be observed, large parts of Egypt and the Sudan (the Sahara Desert) have no vegetation at all. On the other hand, the Lake Victoria region is covered with vegetation throughout the year, so is the Sudd in southern Sudan. This map clearly indicates where water is the main constraint to vegetation growth. It should be noted, however, that it does not consider the quality of the vegetation.