 FAO Map Catalog
population distribution
Type of resources
Available actions
Topics
Keywords
Contact for the resource
Provided by
Years
Formats
Representation types
Update frequencies
status
-
The FGGD high resolution rural settlements population density map is a global raster datalayer with a resolution of 30 arc-seconds. Each pixel classified as rural by the urban area boundaries map but having a population density value of 2000 or above, contains the number of persons per square kilometre. All remaining pixels contain no data. The method used by FAO to generate this datalayer is described in FAO, 2006, Mapping global urban and rural population distributions, by M. Salvatore, et. al.
-
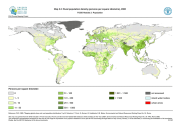
The FGGD rural population density map is a global raster datalayer with a resolution of 5 arc-minutes. Each pixel classified as rural by the urban area boundaries map contains the number of persons per square kilometre, aggregated from the 30 arc-second datalayer. All remaining pixels contain no data. The method used by FAO to generate this datalayer is described in FAO, 2005, Mapping global urban and rural population distributions, by M. Salvatore, et. al.
-
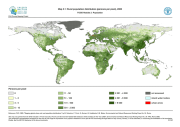
The FGGD high resolution rural population distribution map is a global raster datalayer with a resolution of 30 arc-seconds. Each pixel classified as rural by the urban area boundaries map contains a numeric count of persons in the land area represented by the pixel. All remaining pixels contain no data. The method used by FAO to generate this datalayer is described in FAO, 2006, Mapping global urban and rural population distributions, by M. Salvatore, et. al.
-
The FGGD high-resolution urban population density map is a global raster datalayer with a resolution of 30 arc-seconds. Each pixel classified as urban by the urban area boundaries map contains the number of persons per square kilometre. All remaining pixels contain no data. The method used by FAO to generate this datalayer is described in FAO, 2006, Mapping global urban and rural population distributions, by M. Salvatore, et. al.
-
The FGGD high-resolution urban population distribution map is a global raster datalayer with a resolution of 30 arc-seconds. Each pixel classified as urban by the urban area boundaries map contains a numeric count of persons in the land area represented by the pixel. All remaining pixels contain a negative value. The method used by FAO to generate this datalayer is described in FAO, 2006, Mapping global urban and rural population distributions, by M. Salvatore, et. al.
-
The FGGD rural population distribution map is a global raster datalayer with a resolution of 5 arc-minutes. Each pixel classified as rural by the urban area boundaries map contains a numeric count of persons in the land area represented by the pixel, aggregated from the 30 arc-second datalayer. All remaining pixels contain no data. The method used by FAO to generate this datalayer is described in FAO, 2005, Mapping global urban and rural population distributions, by M. Salvatore, et. al.
-
The FGGD high resolution rural settlements population distribution map is a global raster datalayer with a resolution of 30 arc-seconds. Each pixel classified as rural by the urban area boundaries map but having a population density value of 2000 or above, contains a numeric count of persons in the land area represented by the pixel. All remaining pixels contain a negative value. The method used by FAO to generate this datalayer is described in FAO, 2006, Mapping global urban and rural population distributions, by M. Salvatore, et. al.
-
Population density estimates per sqkm.
-
The FGGD high resolution rural population density map is a global raster datalayer with a resolution of 30 arc-seconds. Each pixel classified as rural by the urban area boundaries map contains the number of persons per square kilometre. All remaining pixels contain no data. The method used by FAO to generate this datalayer is described in FAO, 2006, Mapping global urban and rural population distributions, by M. Salvatore, et. al.
-
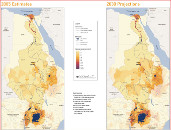
The population prospects in the Nile Basin present two maps of human population distribution in the Nile countries: an estimate for 2005, and a projection for 2030. Landscan 2004 provided the geo-referenced base layer. It was combined with the medium demographic growth variant for 2030, obtained for each Nile country from UNDESA. The maps show the high population densities in the Lake Victoria region, the Nile delta and valley, the Ethiopian highlands, and around Khartoum. Outside the Nile valley, large areas of the Democratic Republic of the Congo, Eritrea, Kenya, the Sudan and the United Republic of Tanzania are sparsely populated. It also shown that the settlement pattern in the lower riparians follows the Nile, while in the upper riparians it tends to follow – broadly – rainfall distribution. Data Sources in details: - United Nations Population Division (UNDESA), 2030 medium variant; - US Bureau of Census, 2005; - LandScan 2004 Distributed Population layer; - AFRICOVER urban areas; - ESRI Gazetteer; - Urban polygons digitized by the project for DR Congo, Egypt and Ethiopia.