 FAO Map Catalog
population density
Type of resources
Available actions
Topics
Keywords
Contact for the resource
Provided by
Years
Formats
Representation types
Update frequencies
status
Resolution
-
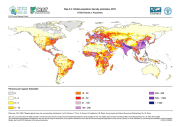
The FGGD estimated 2015 global population density map is a global raster datalayer with a resolution of 2.5 arc-minutes. Each pixel contains an estimated value for persons per square kilometre in 2015, obtained by applying population growth trends to population counts for the lowest subnational administrative unit for which 2000 population data were available. The method used by FAO and CIESIN to generate this datalayer is described in FAO, 2005, Mapping global urban and rural population distributions, by M. Salvatore, et. al.
-
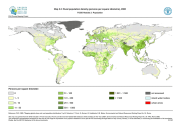
The FGGD high resolution rural settlements population density map is a global raster datalayer with a resolution of 30 arc-seconds. Each pixel classified as rural by the urban area boundaries map but having a population density value of 2000 or above, contains the number of persons per square kilometre. All remaining pixels contain no data. The method used by FAO to generate this datalayer is described in FAO, 2006, Mapping global urban and rural population distributions, by M. Salvatore, et. al.
-
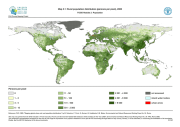
The FGGD rural population density map is a global raster datalayer with a resolution of 5 arc-minutes. Each pixel classified as rural by the urban area boundaries map contains the number of persons per square kilometre, aggregated from the 30 arc-second datalayer. All remaining pixels contain no data. The method used by FAO to generate this datalayer is described in FAO, 2005, Mapping global urban and rural population distributions, by M. Salvatore, et. al.
-
The FGGD high resolution rural population distribution map is a global raster datalayer with a resolution of 30 arc-seconds. Each pixel classified as rural by the urban area boundaries map contains a numeric count of persons in the land area represented by the pixel. All remaining pixels contain no data. The method used by FAO to generate this datalayer is described in FAO, 2006, Mapping global urban and rural population distributions, by M. Salvatore, et. al.
-
The FGGD high-resolution urban population density map is a global raster datalayer with a resolution of 30 arc-seconds. Each pixel classified as urban by the urban area boundaries map contains the number of persons per square kilometre. All remaining pixels contain no data. The method used by FAO to generate this datalayer is described in FAO, 2006, Mapping global urban and rural population distributions, by M. Salvatore, et. al.
-
The FGGD high-resolution urban population distribution map is a global raster datalayer with a resolution of 30 arc-seconds. Each pixel classified as urban by the urban area boundaries map contains a numeric count of persons in the land area represented by the pixel. All remaining pixels contain a negative value. The method used by FAO to generate this datalayer is described in FAO, 2006, Mapping global urban and rural population distributions, by M. Salvatore, et. al.
-
The FGGD rural population distribution map is a global raster datalayer with a resolution of 5 arc-minutes. Each pixel classified as rural by the urban area boundaries map contains a numeric count of persons in the land area represented by the pixel, aggregated from the 30 arc-second datalayer. All remaining pixels contain no data. The method used by FAO to generate this datalayer is described in FAO, 2005, Mapping global urban and rural population distributions, by M. Salvatore, et. al.
-
The dataset represents population density calculated based on FAOSTAT data 2017.
-
The Food and Agriculture Organization of the United Nations (FAO) with the collaboration of the International Institute for Applied Systems Analysis (IIASA), has developed a system that enables rational land-use planning on the basis of an inventory of land resources and evaluation of biophysical limitations and potentials. This is referred to as the Agro-ecological Zones (AEZ) methodology.
-
The FGGD high resolution rural settlements population distribution map is a global raster datalayer with a resolution of 30 arc-seconds. Each pixel classified as rural by the urban area boundaries map but having a population density value of 2000 or above, contains a numeric count of persons in the land area represented by the pixel. All remaining pixels contain a negative value. The method used by FAO to generate this datalayer is described in FAO, 2006, Mapping global urban and rural population distributions, by M. Salvatore, et. al.