 FAO Map Catalog
pasture
Type of resources
Available actions
Topics
Keywords
Contact for the resource
Provided by
Formats
Representation types
Update frequencies
status
-

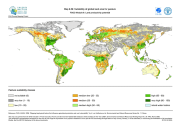
The FGGD pasture suitability map on currently available land is a global raster datalayer with a resolution of 5 arc-minutes. Pixels classified as urban, closed forest or irrigated contain negative values. Each remaining pixel contains the suitability index for pasture, 2005 version. The method is described in FAO and IIASA, 2007, Mapping biophysical factors that influence agricultural production and rural vulnerability, by H. von Velthuizen et al.
-
The FGGD pasture suitability map is a global raster datalayer with a resolution of 5 arc-minutes. Each pixel contains the suitability index for pasture, 2005 version. The method is described in FAO and IIASA, 2007, Mapping biophysical factors that influence agricultural production and rural vulnerability, by H. von Velthuizen et al.
-

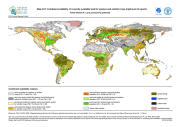
The FGGD combined suitability maps at low, intermediate and high levels of inputs under rainfed conditions on currently available land are global raster datalayers with a resolution of 5 arc-minutes. Pixels classified as urban, closed forest or irrigated contain negative values. Each remaining pixel contains a combined suitability class value for rainfed agriculture, based on the 2005 version of the suitability indexes for rainfed production of all crops plus pasture. The method is described in FAO and IIASA, 2007, Mapping biophysical factors that influence agricultural production and rural vulnerability, by H. von Velthuizen et al.
-

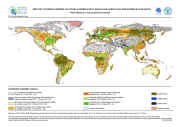
The FGGD combined suitability maps at low, intermediate and high levels of inputs under rainfed conditions on global land area are global raster datalayers with a resolution of 5 arc-minutes. Each pixel contains a combined suitability class value for rainfed agriculture, based on the 2005 version of the suitability indexes for rainfed production of all crops plus pasture. The method is described in FAO and IIASA, 2007, Mapping biophysical factors that influence agricultural production and rural vulnerability, by H. von Velthuizen et al.
-
The FGGD combined suitability maps at low, intermediate and high levels of inputs under rainfed conditions on currently available land are global raster datalayers with a resolution of 5 arc-minutes. Pixels classified as urban, closed forest or irrigated contain negative values. Each remaining pixel contains a combined suitability class value for rainfed agriculture, based on the 2005 version of the suitability indexes for rainfed production of all crops plus pasture. The method is described in FAO and IIASA, 2007, Mapping biophysical factors that influence agricultural production and rural vulnerability, by H. von Velthuizen et al.
-

The FGGD combined suitability maps at low, intermediate and high levels of inputs under rainfed conditions on global land area are global raster datalayers with a resolution of 5 arc-minutes. Each pixel contains a combined suitability class value for rainfed agriculture, based on the 2005 version of the suitability indexes for rainfed production of all crops plus pasture. The method is described in FAO and IIASA, 2007, Mapping biophysical factors that influence agricultural production and rural vulnerability, by H. von Velthuizen et al.
-
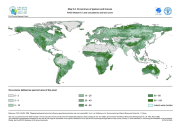
The FGGD land cover occurrence maps are global raster datalayers with a resolution of 5 arc-minutes. Each pixel in each map contains a value representing the percentage of the area belonging to the land cover type concerned. The method is described in FAO and IIASA, 2007, Mapping biophysical factors that influence agricultural production and rural vulnerability, by H. von Velthuizen et al.