 FAO Map Catalog
meteorology
Type of resources
Available actions
Topics
Keywords
Contact for the resource
Provided by
Years
Formats
Representation types
Update frequencies
status
Scale
Resolution
-
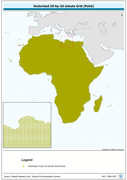
Vectorized 10-by-10 minute Grid (Point). The CRU_PT shapefile data layer is comprised of 92718 derivative calculated climate features derived based on 0.167 degrees resolution data originally from CRU. The layer provides nominal analytical/mapping at 1:70 000 000. Acronyms and Abbreviations: CRU - Climatic Research Unit - School of Environmental Sciences, University of East Anglia - Norwich.
-
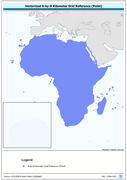
Vectorized 8-by-8 Kilometer Grid Reference (Point). The RFE_PT shapefile data layer is comprised of 471688 derivative calculated precipitation features derived based on 8 kilometers data originally from EDC. The layer provides nominal analytical/mapping at 1:35 000 000. Acronyms and Abbreviations: EDC - USGS EROS (Earth Resources Observation Systems) Data Center.
-
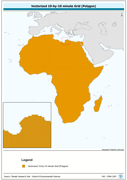
Vectorized 10-by-10 minute Grid (Polygon). The CRU_PY shapefile data layer is comprised of 92718 derivative calculated climate features derived based on 0.167 degrees resolution data originally from CRU. The layer provides nominal analytical/mapping at 1:70 000 000. Acronyms and Abbreviations: CRU - Climatic Research Unit - School of Environmental Sciences, University of East Anglia - Norwich.
-
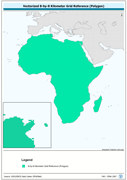
Vectorized 8-by-8 Kilometer Grid Reference (Polygon). The RFE_PY shapefile data layer is comprised of 471688 derivative calculated precipitation features derived based on 8 kilometers data originally from EDC. The layer provides nominal analytical/mapping at 1:35 000 000. Acronyms and Abbreviations: EDC - USGS EROS (Earth Resources Observation Systems) Data Center.
-

Grid of estimated aridity with a spatial resolution of 10 arc minutes. This dataset represents average yearly precipitation divided by average yearly potential evapotranspiration, an aridity index defined by the United Nations Environmental Programme (UNEP). The classification of the aridity index is: - Classification Aridity Index Global land area - Hyperarid AI < 0.05 - 7.5% of the global land area - Arid 0.05 < AI < 0.20 - 12.1% of the global land area - Semi-arid 0.20 < AI < 0.50 - 17.7% of the global land area - Dry subhumid 0.50 < AI < 0.65 - 9.9% of the global land area
-
Grid with average Wet Day Frequency (rain days per month) for the period 1961-1990. This dataset is constructed from observations, backed with synthetic data derived from precipitation. Source: New, M., Lister, D., Hulme, M. and Makin, I., 2002: A high-resolution data set of surface climate over global land areas. Climate Research 21:1-25
-

Grids with monthly values of coefficient of variation of precipitation for the period 1961-1990, at 5 arc min. Based on: New, M., Lister, D., Hulme, M. and Makin, I., 2002: A high-resolution data set of surface climate over global land areas. Climate Research 21:1-25
-
Grid with estimated reference evapotranspiration per month with a spatial resolution of 10 arc minutes. The dataset contains mean monthly values for global land areas, excluding Antarctica, for the period 1961-1990. The dataset has been prepared according to the FAO Penman - Monteith method with limited climatic data as described in FAO Irrigation and Drainage Paper 56. The dataset consists of 12 ASCII-grids with mean monthly data in mm/day * 10, and one ASCII-grid with yearly data in mm/year.
-
Grid with estimated yearly reference evapotranspiration with a spatial resolution of 10 arc minutes. The dataset contains average values for global land areas, excluding Antarctica, for the period 1961-1990. The dataset has been prepared according to the FAO Penman - Monteith method with limited climatic data as described in FAO Irrigation and Drainage Paper 56. The dataset consists one ASCII-grid with yearly data in mm/year. ASCII-grids with mean monthly data in mm/day * 10 are also available as described in the associated resources of this metadata.
-
Grid with estimated yearly precipitation with a spatial resolution of 10 arc minutes. The dataset contains average values for global land areas, excluding Antarctica, for the period 1961-1990. The dataset has been prepared according to the FAO Penman - Monteith method with limited climatic data as described in FAO Irrigation and Drainage Paper 56. The dataset consists one ASCII-grid with yearly data in mm/year. ASCII-grids with mean monthly data in mm/day * 10 are also available as described in the associated resources of this metadata.