 FAO Map Catalog
landuse
Type of resources
Available actions
Topics
Keywords
Contact for the resource
Provided by
Formats
Representation types
Update frequencies
status
Scale
-
This map represents the spatial distribution of land under irrigation which is affected by some degree of salinization. It was produced by combining FAO AQUASTAT country statistics regarding irrigated areas affected by salinization with spatial information on irrigated areas where precipitation is not sufficient to leach away salt residues that are built up in the soil due to irrigation. It was assumed that the risk of salinization of irrigated areas can occur only in areas with an Aridity Index lower than 0.65 (where the Aridity Index is defined as Yearly Precipitation divided by Yearly Reference Evapotranspiration).
-
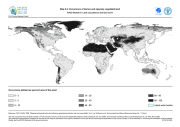
This map, compiled to support the analysis of SOLAW report concerning land tenure and water rights (FAO -NRL, SOLAW 2010 Report 5A - Hotspots of land tenure and water rights) shows the population growth rate, in percentage, according to CIA Factbook 2006. The need to feed 9 billion people by 2050 implies that the pressure on land and water will generally increase. Countries with the highest population growths rate are also those for which the number of calories available per person per day is lower. They are also, in part, countries in which the volume of water available per capita and year is the lowest.
-
The map shows the dominant soil and terrain constraints of land for high input farming conditions. The map was developed within the IIASA/FAO GAEZ 2009 modelling framework. Agricultural input and management increases can help to overcome to some degree soil and terrain constraints in all regions, most visible in the maps in particular in Eastern Africa, India and Australia.
-

The FGGD total currently available land map is a global raster datalayer with a resolution of 5 arc-minutes. Pixels classified as urban, closed forest, or irrigated are indicated as land not currently available for rainfed agriculture. All remaining pixels classified as other land represent land currently available for rainfed agriculture. The method is described in FAO and IIASA, 2007, Mapping biophysical factors that influence agricultural production and rural vulnerability, by H. von Velthuizen et al.
-
The map accompanies the SOLAW report 14 âWhere are the poor and where are the land and water resourcesâ. The analysis addressed in this report is aimed at identifying areas where land, water resources and farming systems pose potential threats to livelihoods. In particular this map, accompanying the report, shows the per capita share of easily available water by region. The data for the analysis comes from the FAO GeoNetwork data archive. The methodology draws from the main hypotheses set in the analysis that are to: ⢠test if per capita share of land and water resources have a significant association with poverty ⢠if land suitability and farming systems modify that relationship. Principal Component Analysis (PCA) is used to derive a single resource management index based on land and water resources, land suitability and farming systems. PCA involves a mathematical procedure that transforms a number of correlated variables into a smaller number of uncorrelated variables called Principal Components (PC). The new sets of variables (PCs) are a linear combination of the original variables which are derived in decreasing order of importance, with the first principal component accounting for as much of the variability in the data as possible, and each succeeding component accounts for as much of the remaining variability. The first PC, which is a measure of variability in access to land and water resources and in farming systems, is chosen as the resource management index. The results from the analysis are presented in the form of graphs and maps that answer the following questions: ⢠Where are the rural poor concentrated? ⢠Where are the poor in relation to land and water resources and farming systems? ⢠To what extent do access to land and water resources and current farming systems constrain livelihoods for the poor? ⢠Can changes in resource management modify poverty outcomes in resource-constrained areas? The map shows per capita share of easily available water by region and rural-urban localities. Per capita share of easily available water is lowest in Asia â 5.8 mm/month per 1000 people. In Europe, America and Africa it is 6.2, 14.8 an 15.2 mm/month per 1000 people, respectively compared to 37.7 mm/month per 1000 in Oceania. Substantial rural-urban differentials exist in per capita share of easily available water. In rural areas of Asia, per capita share of easily available water is only 0.46 mm/month per 1000 people compared to 10.2 in urban areas of Asia.
-
The map accompanies the SOLAW report 8 âAgriculture and water quality interactionsâ. Arsenic contamination in groundwater has been reported in more than 20 countries around the world and, in many, shallow groundwater is used for both drinking and irrigation purposes. Natural arsenic in groundwater at concentrations above the drinking water standard of 10 µg/litre is not uncommon, and the realization that water resources can contain insidious toxic concentrations of naturally-occurring chemical constituents, such as arsenic, is fairly recent and increasingly urgent. First estimates of arsenic toxicity (arsenosis) from drinking water, causing skin lesions and various types of cancers, indicate about 130 million people are impacted. Although the main geochemical mechanisms of arsenic mobilization are well understood, and there are important cases reported around the world, the real worldwide scale of affected regions is still unknown. Amini. et al 2008 conducted a study using a large database of measured arsenic concentration in groundwater (around 20,000 data points) from around the world as well as digital maps of physical characteristics such as soil, geology, climate, and elevation to model probability maps of global arsenic contamination. This map therefore shows, at global scale, probability of geogenic arsenic contamination in groundwater for oxidizing groundwater conditions, based on modelling the above information.
-

The map illustrates an analysis carried out within the FAO-GLADIS framework. The analysis considers the changes in the provisioning capacity of ecosystems matched with an analysis of impacts on people. This analysis, conducted in GLADIS, uses degradation trends linked to poverty levels of the population affected (LDI*Poverty class*Population, excluding low poverty regions). The map is in the SOLAW Report 6 - Land Degradation.
-
The FGGD land cover occurrence maps are global raster datalayers with a resolution of 5 arc-minutes. Each pixel in each map contains a value representing the percentage of the area belonging to the land cover type concerned. The method is described in FAO and IIASA, 2007, Mapping biophysical factors that influence agricultural production and rural vulnerability, by H. von Velthuizen et al.
-
The map accompanies the SOLAW report 8 âAgriculture and water quality interactionsâ. Arsenic contamination in groundwater has been reported in more than 20 countries around the world and, in many, shallow groundwater is used for both drinking and irrigation purposes. Natural arsenic in groundwater at concentrations above the drinking water standard of 10 µg/liter is not uncommon, and the realization that water resources can contain insidious toxic concentrations of naturally-occurring chemical constituents, such as arsenic, is fairly recent and increasingly urgent. First estimates of arsenic toxicity (arsenosis) from drinking water, causing skin lesions and various types of cancers, indicate about 130 million people are impacted. Although the main geochemical mechanisms of arsenic mobilization are well understood, and there are important cases reported around the world, the real worldwide scale of affected regions is still unknown. . Amini. et al 2008 conducted un study using a large database of measured arsenic concentration in groundwater (around 20,000 data points) from around the world as well as digital maps of physical characteristics such as soil, geology, climate, and elevation to model probability maps of global arsenic contamination. This map therefore shows, at global scale, probability of geogenic arsenic contamination in groundwater for reducing groundwater conditions, based on modelling the above information.
-
The map shows the results of the land suitability assessment, undertaken with the IIASA/FAO GAEZ 2009 modelling framework. The results comprise spatially detailed quantified potentials of individual crops and quality of land resources. AEZ modelling uses detailed agronomic-based knowledge to simulate land resources availability, assess farm-level management options and estimate crop production potentials. The suitability assessments provide extents for a range of suitability classes by means of an index: Very suitable, suitable, moderately suitable, marginally suitable, very marginally suitable and not suitable, calculated as follows; SI= VS*0.9+ S*0.7+MS*0.5+mS*0.3+ VmS*0.1 Where: VS very suitable land (80-100% of maximum attainable yield) S suitable land (60-80% of attainable yield) MS moderately suitable land (40-60% of maximum attainable yield) mS marginally suitable land (20-40% of maximum attainable yield) VmS very marginally suitable land (5-20% of maximum attainable yield)