 FAO Map Catalog
hydrology
Type of resources
Available actions
Topics
Keywords
Contact for the resource
Provided by
Years
Formats
Representation types
Update frequencies
status
Scale
-
The map is compiled for the SOLAW Report: "Sources of water for agriculture". Data are available from AQUASTAT - programme of the Land and Water Division of the Food and Agriculture Organization of the United Nations. Perhaps the most widespread indicator of water scarcity at country level that can be found in literature is per capita availability of average renewable water resources, using threshold values of 500, 1 000 and 1 700 m3/person per year (Falkenmark and Widstrand, 1992; UN-Water, 2006b). Under this system countries or regions are considered to be facing absolute water scarcity if water availability is < 500 m3 per capita per year, chronic water shortage if water availability is between 500 and 1 000 m3, regular water stress between 1 000 and 1 700 m3, and occasional stress or local stress can occur also at levels above 1 700 m3. This relatively simple approach to measuring water scarcity was primarily based on estimates of the number of people who can reasonably live with a certain unit of water resources (Falkenmark, 1984). This indicator is widely used because it can be easily calculated for every country in the world and for every year, based on long-term average annual water resources data (FAO, 2010a) and available population data (UN, 2009).
-

This map provides a representation of levels of water scarcity by major hydrological basin, expressed in terms of the ratio between irrigation water that is consumed by plants through evapotranspiration and renewable fresh water resources. Contrarily to previous water scarcity maps, this map uses consumptive use of water rather than water withdrawal. Renewable fresh water resources as well as net irrigation water requirements in the river basin are calculated through a water balance model, with information regarding climate, soils and irrigated agriculture as input data. The legend distinguishes three classes: • Water scarcity in river basins where evapotranspiration due to irrigation is less than 10% of the total renewable water resources is classified as low; • Water scarcity in river basins where evapotranspiration due to irrigation is in between 10% and 20% of the total renewable water resources is classified as moderate; • Water scarcity in river basins where evapotranspiration due to irrigation is more than 20% of the total renewable water resources is classified as high.
-
This map shows the extent of land area equipped for irrigation -expressed as percentage- around the turn of the 20th century according to the Global Map of Irrigation Areas (version 4.0.1), together with areas of rainfed agriculture. Data are available from AQUASTAT - programme of the Land and Water Division of the Food and Agriculture Organization of the United Nations.
-
Vectorized CRES 3-by-3 Minute Point Reference. The CRES_PT shapefile data layer is comprised of 1004351 derivative calculated water temperature features derived based on 0.5 degrees resolution data originally from CRES/FAO. The layer provides nominal analytical/mapping at 1:220 000 000. Acronyms and Abbreviations: CRES - Centre for Resource and Environmental Studies, The Australian National University (ANU).
-
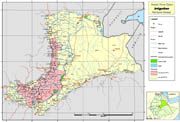
Wereda (administrative units) covered by pilot survey of irrigation schemes for the project GCP/GLO/207/ITA
-
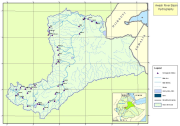
Awash River Basin hydrographic data used for the project GCP/GLO/207/ITA, including rivers, lakes and hydrographic stations within the basin.
-
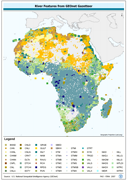
GNS_RIV: GNS/GeoNet named river confluence & outflow locations Value-added derivative of source w/non-diacritical names of river confluence's. The GNS_RIV shapefile data layer is comprised of 138700 derivative point gazetteer features derived based on 1:250 000 data originally from GEOnet. The layer provides nominal analytical/mapping at 1:250 000. Data processing is complete globally, this is an African subset. Acronyms and Abbreviations: GNS/GeoNet - NIMA?s Geographic Names Server Gazetteer of Named Locations; NIMA - U.S. National Imagery & Mapping Agency, formerly the U.S. Defense Mapping Agency (DMA).
-

Remote Sensing based Water Accounting (WA+) of the Helmand River Basin (Afghanistan, Iran, Pakistan). Spatially explicit results include: land and water use classification, actual evapotranspiration, biomass, yields, irrigated crop water productivity. More information on WA+ is available through www.wateraccounting.org
-
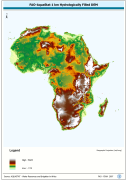
WRIA_DEM: Hydrologically filled GTopo30 DEM with the main stems of cartographic rivers "burned-in" for irrigation analysis. GT30/GTopo30 is Global Topographic 30 arc second DEM database, nominal 1km postings; DEM is Digital Elevation Model. The WRIALAEA grid data layer is comprised of 9194x8736 derivative raster hydrologically filled dem features derived based on 1 kilometer data originally from FAO.
-
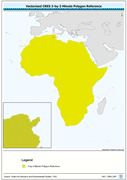
Vectorized CRES 3-by-3 Minute Polygon Reference. The CRES_PY shapefile data layer is comprised of 1004351 derivative calculated climate features derived based on 0.5 data originally from CRES/FAO. The layer provides nominal analytical/mapping at 1:220 000 000. Acronyms and Abbreviations: CRES - Centre for Resource and Environmental Studies, The Australian National University (ANU).