 FAO Map Catalog
food security
Type of resources
Available actions
Topics
Keywords
Contact for the resource
Provided by
Years
Formats
Representation types
Update frequencies
status
-
The FGGD land cover occurrence maps are global raster datalayers with a resolution of 5 arc-minutes. Each pixel in each map contains a value representing the percentage of the area belonging to the land cover type concerned. The method is described in FAO and IIASA, 2007, Mapping biophysical factors that influence agricultural production and rural vulnerability, by H. von Velthuizen et al.
-
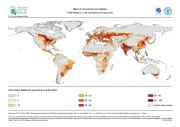
Estimate of food self sufficiency based on population density and expressed in terms of the number of kilograms per person. The map also includes protected areas.
-
Estimate of food self suffficieny based on population density and expressed in terms of the number of kilograms per person.The map also includes protected areas.
-

DAD-IS is the key communication and information tool for implementing the Global Strategy for the Management of Farm Animal Genetic Resources (AnGR). DAD-IS provides: - guidelines to assist countries manage their AnGR; - searchable database on origin, population, risk status, performance and morphology of more than 14,000 breed populations of 35 species in 189 countries and updating functionality for National Coordinators; - a Global Early Warning System for AnGR; - searchable library of full texts and links to other websites related to AnGR management and the Global Strategy; - a forum for exchange of ideas and techniques in the area of AnGR management; and - country, regional and global contacts.
-

The Gridded Livestock of the World (GLW) is a global livestock mapping project by the Food and Agriculture Organization's Animal Production and Health Division (FAO-AGA). It describes the global spatial distribution of cattle, buffaloes, sheep, goats, pigs and poultry. The most-detailed sub-national census data are disaggregated based on statistical relations with some environmental variables in similar agro-ecological zones.
-
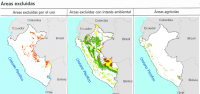
The environmental and land use constraints identify areas that in Peru could not be available for bioenergy activities due to diverse reasons. They show the land already under agriculture production, protected or environmentally sensitive areas, urban settlements etc. that have been excluded from the BEFS land suitability assessment of Peru, in order to get a true understanding of which lands are available for bioenergy production in this country. In particular the following maps of constraints have been identified: 1) "Excluded areas" map, which includes not available areas due to restrictions by national legislation, like: i) water bodies and rivers (information extracted from IGN), lakes (extracted Map Forest-INRENA 2000); ii) forest concessions and chestnuts concessions (INRENA-concessions obtained by public-contest); iii) reservoir, mountains and village (taken from the Forest Map). 2) "Areas of environmental concern" map which includes areas where it is not possible to intervene by national law restrictions or different environmental protection mechanisms. It contains the following information: (i) protected forest (Map Forestal INRENA 2000); (Ii) protected areas for reforestation (Map Reforestation-INRENA 2000); (Iii) protected areas and areas complementary, native communities (National System of Protected Areas-SINANPE), (iv) territorial reserve (surface in favor of indigenous peoples living in isolation INRENA), (v) swamps, wetlands and mangroves (land cover map-INRENA 2000). 3) "Agricultural areas" map which identify areas with potential conflict between bioenergy and food production. The information in agricultural areas is taken from Forest-mining Category map crop farming- (Forest Map of INRENA 2000). All BEFS results have been reported in the FAO publication “Bioenergía y seguridad alimentaria - El análisis de BEFS para el Perú - Compendio técnico Vol I y II†and the final products made available in this catalogue.
-
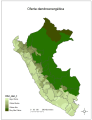
This map shows that forest biomass is unevenly distributed the Peruvian territory. This heterogeneous distribution of resources is the result of geographical and climatic variability that characterizes this country. The forest ecosystem has the largest amount of forest biomass available, while the coastal area and the mountains in the south have limited supply of biomass. This uneven distribution is the result of the tropical humid climate of the jungle, the desert climate in the coast and the limited availability of water in the southern highlands. This distribution of forest biomass, its relationship with the weather, the population distribution in the country and poverty, deserve studies locally. It is noted that the southern highlands is the part with most poverty in the country and is known as the Andean trapeze. The region with the largest supply of biomass is Loreto 145 Mt per year, other regions such as Amazonas, Cusco and San Martin have about 10 Mt per year. While regions that have a limited supply of woody biomass are: Arequipa, Moquegua and Tacna 15 000 17 700 and 14 000 Mt per annum respectively. Source data: - Dirección General Forestal de Faura Silvestre (DGFF). 2009. Perú forestal en números, ano 2008. Ministerio de Agricultura-DGFF. Lima. - INRENA. 2005. Mapa Forestal del Perú 2000. (No public). - INEI, 2008. Perfil socioeconómico del Perú. 2da. Edición. Census Nacionales 2007. XI de población y VI de vivienda. Lima. This dataset is part of the result of the Bioenergy and Food Security (BEFS) analysis for Perú on land and agro-climatic suitability and availability for crops. All BEFS results have been reported in the FAO publication “Bioenergía y seguridad alimentaria - El análisis de BEFS para el Perú - Compendio técnico Vol I y II†and the final products made available in this catalogue.
-

This map shows as the provinces of Chiclayo (Lambayeque), Ascope (La Libertad) and Santa (Ancash) in the coastal region of Peru, produce the highest amount of waste from agricultural, agro-industrial and logging activities. They are also the provinces with the largest agricultural production in the country. However, one limitation to the use of agricultural residues is the existence of a rule prohibiting the transfer of this waste between provinces for health reasons, to prevent pests and diseases. This prohibition would impose in each province a plant processing mechanism before transferring the waste to energy plant production, with a consequent resulting in increased production costs. With regard to livestock, the possibilities for the use of manure energy purposes is limited to options for domestic consumption and, in a few cases, consumption for production processes on a small scale. In the forest region of Peru, the largest agricultural production areas correspond to areas of greatest deforestation. The traditional presence of sawmills in this region identifies forest residues as well. However the map shows sawmill residues also in those areas that are not covered by forests (see Moquegua and Tacna). This is because timber flows occur between regions all over the country, to allow the woodwork and meet local demand. Source data: - Dirección General Forestal de Faura Silvestre (DGFF). 2009. Perú forestal en números, ano 2008. Ministerio de Agricultura-DGFF. Lima. - Ministerio de Agricultura (MINAG). 2007. Compendio Estadístico Agrario 1997-2005. Lima. This dataset is part of the result of the Bioenergy and Food Security (BEFS) analysis for Peru on land and agro-climatic suitability and availability for crops. All BEFS results have been reported in the FAO publication “Bioenergía y seguridad alimentaria - El análisis de BEFS para el Perú - Compendio técnico Vol I y II†and the final products made available in this catalogue.
-
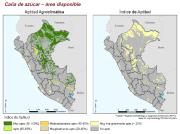
This dataset presents the result of the Bioenergy and Food Security (BEFS) analysis for Peru on land and agro-climatic suitability and availability for sugarcane. In particular it reports the available area suitable for sugarcane production at different levels of suitability, considering the tillage-based (TA) production system, high level of inputs and existing irrigation systems. Land already under agriculture production or protected or environmentally sensitive has been excluded from the land suitability total area, in order to get a true understanding of which lands are available for bioenergy production in this country. Please note that the "Excluded areas" layers, used to identify areas that in Peru could not be available for bioenergy activities, are also available in this catalogue. You may find the link to them in the Distribution Information section of this metadata. The land suitability index categorizes the capability of a specific location to achieve the maximum attainable yield in percentage terms. The maximum attainable yield is defined as the harvested yield of a high-producing variety with “constraint-free†conditions (water, nutrients and pests and disease), which can be achieved under a specific production system and level of inputs. In Peru the analysis of Land Suitability Assessment (LSA) was held also for oil palm and white pinion (Jatropha) under two production systems, namely Tillage-based (TA) and Conservation agriculture (CA) and under low and high inputs. The two production systems and two input levels result in four agricultural configurations: 1 - Tillage-based at low inputs (TA-L) 2 - Tillage-based at high inputs (TA-H) 3 - Conservation agriculture at low inputs (CA-L) 4 - Conservation agriculture at high inputs (CA-H) Source data: MINAG, 2008. Series histórica de producción agrícola. http://frenteweb.minag.gob.pe/sisca/?mod=consulta_cult All BEFS results have been reported in the FAO publication “Bioenergía y seguridad alimentaria - El análisis de BEFS para el Perú - Compendio técnico Vol I y II†and the final products made available in this catalogue.
-

This map shows the distribution of the total supply of woody biomass in Peru. It is important to notice that provinces with higher wood energy supply have also the highest total supply: Alto Amazonas, Loreto Mariscal Ramón Castilla y Requena (Loreto) and Atalaya (Ucayali) have a higher total supply to 16 Mt per year. This shows that the greatest potential for biomass resources for energy generation in Peru comes from the rainforest. The province that has fewer total biomass resources is Yunguyo (Puno) just 16 tons. This figure coincides with the wood energy supply, since in this province there are no forests, non-agricultural activities and not forest industries that are generating waste. Candarave (Tacna) and La Union (Arequipa) also have low total supply of biomass. White areas on the map correspond to the coastal deserts and xeric southern highlands. These areas have a limited supply of biomass, which should be developed in the geographical area of energy efficiency programs. Other white areas, particularly in the forest ecosystem, correspond to protected areas which were not considered in the analysis. Source data: - Dirección General Forestal de Faura Silvestre (DGFF). 2009. Perú forestal en números, ano 2008. Ministerio de Agricultura-DGFF. Lima. - INEI, 2008. Perfil socioeconómico del Perú. 2da. Edición. Census Nacionales 2007. XI de población y VI de vivienda. Lima. - Ministerio de Agricultura (MINAG). 2007. Compendio Estadístico Agrario 1997-2005. Lima This dataset is part of the result of the Bioenergy and Food Security (BEFS) analysis for Perú on land and agro-climatic suitability and availability for crops. All BEFS results have been reported in the FAO publication “Bioenergía y seguridad alimentaria - El análisis de BEFS para el Perú - Compendio técnico Vol I y II†and the final products made available in this catalogue.