 FAO Map Catalog
exposure
Type of resources
Available actions
Topics
Keywords
Contact for the resource
Provided by
Years
Representation types
Update frequencies
status
Resolution
-
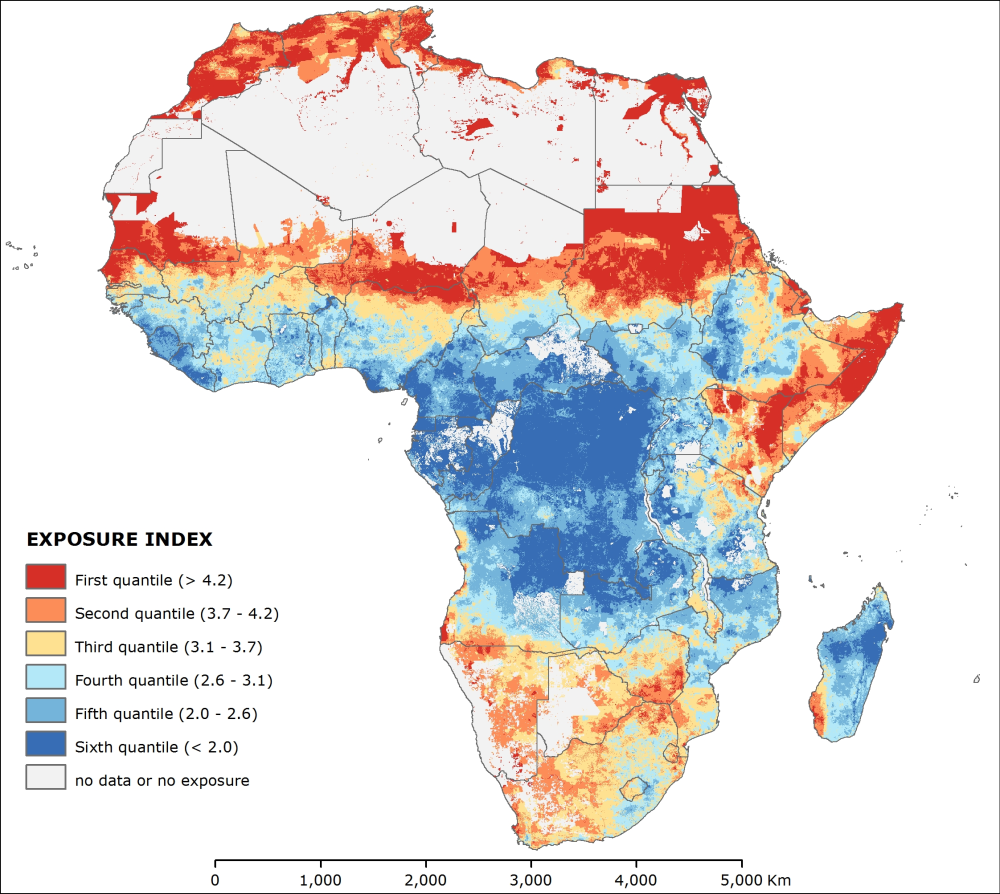
The “exposure index” relates to exposure that is the degree of climatic stress upon a particular unit of analysis or element at risk in 2010. The exposure is commonly defined like the combination between the density of element at risk and a hazard. Here the elements at risk are people, livestock units and crop land and the hazard is the climate change and its impacts. Thus the index results from the addition of two underlying indexes: the “element at risk index” and the “climatic stress index”. The relative weights of underlying indexes were 0.28 and 0.72 respectively for the “element at risk” and the “climatic stress indexes”. These weights were defined through Principal Component Analysis (retaining three components) among ten variables which compose the two underlying indexes. This dataset has been produced in the framework of the “Climate change predictions in Sub-Saharan Africa: impacts and adaptations (ClimAfrica)” project, Work Package 4 (WP4). More information on ClimAfrica project is provided in the Supplemental Information section of this metadata.
-

The “vulnerability index” represents the level of vulnerability of a certain region to climate change impacts, given the situation of 2010. The index results from the multiplication of the “exposure index” by the “sensitive index”, and divided by the “adaptive capacity index”. The relative weights were defined through Principal Component Analysis (PCA) among the natural logarithm of the variables which compose the underlying indexes, and they were used like exponential coefficient (0.11 for exposure, 0.33 for sensitivity and 0.56 for adaptive capacity). Alternatively an additive model can be adopted. In this case the PCA run among the underlying variables. However, the result was not significantly different. This dataset has been produced in the framework of the “Climate change predictions in Sub-Saharan Africa: impacts and adaptations (ClimAfrica)” project, Work Package 4 (WP4). More information on ClimAfrica project is provided in the Supplemental Information section of this metadata.
-

The “element at risk index” describes the distribution in 2010 of the density of element (i.e. people, livestock unit or crop land) that are potentially threaded by climatic stress. When a climatic stress impact a densely populated (in terms of element at risk) the impact is likely to be more severe than it would be in areas with fewer element. The index results from the second cluster of the Principal Component Analysis (PCA) performed among potential 10 variables. The analysis identify three dominant variables, namely “people”, “livestock unit” and “crop land”, assigning a weight of 0.3 to people and weights of 0.35 to the other two variables. Before to perform the analysis the variables were log transformed to shorten the extreme variation and then score-standardized (converted to distribution with average of 0 and standard deviation of 1) in order to be comparable. The 0.5 arc-minute grid of population distribution in 2010 were gathered from Worldpop project website. The methodological approach used by Worldpop Project is described in Tatem et al 2007 (DOI: 10.1371/journal.pone.0001298). The values were adjusted in order to have national population totals equal to the UN Population and Demographic Office estimation per Country (World Population Prospect - the 2012 Revision). The 3 arc-minute grid of livestock distribution were gathered from FAO GeoNetwork (cattle, sheep, goats, pigs and poultry distribution), sampled at 0.5 arc-minute. The values were adjusted to national total livestock abundance in 2010 (FAO stats). The single species abundances were converted to livestock unit (LSU) according FAO methodology. The 0.5 arc-minute grid of crop land distribution were collected from FAO Global Land Cover-SHARE of 2014. The area with less than 1 people and 1 LSU for cell (about 1 Km square) and without cropland were masked and removed from the analysis for all layer because considered not exposed to climatic stress. This dataset has been produced in the framework of the “Climate change predictions in Sub-Saharan Africa: impacts and adaptations (ClimAfrica)” project, Work Package 4 (WP4). More information on ClimAfrica project is provided in the Supplemental Information section of this metadata.
-

The “climatic stress index” symbolizes the pattern in 2010 of the climatic stresses (i.e. people, livestock unit or crop land) that potentially threaded the people in Africa. Strong and frequent climatic change impact the element at risk and may lead to severe consequence on food and water availability. The index results from the first and the third clusters (here combined) of the Principal Component Analysis performed among potential 10 variables. The analysis identify five dominant variables, namely “coefficient of variation for inter annual rainfall”, “probability of not exceeding 300 mm of rainfall”, “reliable annual precipitation”, “rainfall trend coefficient” and “number of year with negative Standardized Precipitation Index”, assigning a weight of 0.25 the first three variables and 0.125 for the last two variables. Before to perform the analysis the variables “coefficient of variation for inter annual rainfall” and “probability of not exceeding 300 mm of rainfall” were log transformed to shorten the extreme variation and then the five variables were score-standardized (converted to distribution with average of 0 and standard deviation of 1) in order to be comparable. All the variables are 0.5 arc-minute grids, representing the current average condition, and were produced within the ClimAfrica project. The “coefficient of variation for inter annual rainfall” is a measure of precipitation variability relative to the climatological mean precipitation. The local variation of rainfall between years gives a good indicator of where droughts are most often experienced. Similarly the “number of year with negative Standardized Precipitation Index” assesses the frequency of drought event. To calculate it, SPI 110 years maps were collected and were evaluated how many times a drought (SPI values less than - 0.5) occurred in each cells. The “probability of not exceeding 300 mm of rainfall” and the “reliable annual precipitation” are indicator of climatological rainfall average, thus important indicators of climatic stress for rain-fed based agriculture system. Finally the change (expressed by the “rainfall trend coefficient”) of rainfall during the past 110 years approximate the intensity of climate change in such period. This dataset has been produced in the framework of the “Climate change predictions in Sub-Saharan Africa: impacts and adaptations (ClimAfrica)” project, Work Package 4 (WP4). More information on ClimAfrica project is provided in the Supplemental Information section of this metadata.