 FAO Map Catalog
aquaculture
Type of resources
Available actions
Topics
Keywords
Contact for the resource
Provided by
Years
Formats
Representation types
Update frequencies
status
-
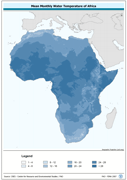
Predicted mean monthly water temperature (annual). Predictions based on air temperature estimates by the Center for resource and Enviornmental Studies (CRES) which can be interpreted as estimates of standard means for the period of 1920 to 1980 and mean annual wind velocity estimated by UNEP/GRID. The WATTMP_MN grid data layer is comprised of 1450x1380 derivative raster water temperature features derived based on 0.05 degrees resolution data originally from CRES/FAO. The layer provides nominal analytical/mapping at 1:20 000 000. Madagascar not included. The following layers are also vailable for download: Majority Monthly Water Temperature (Annual) Maximum Monthly Water Temperature (Annual) Median Monthly Water Temperature (Annual) Minimum Monthly Water Temperature (Annual) Minority Monthly Water Temperature (Annual) Range of Monthly Water Temperature (Annual) Monthly Water Temperature from January to December Acronyms and Abbreviations: CRES - Centre for Resource and Environmental Studies, The Australian National University (ANU); FAO - Food and Agriculture Organization of the United Nations; UNEP - United Nations Environment Programme
-

Predicted mean monthly air temperature (annual). Predictions based on estimates by the Center for resource and Enviornmental Studies (CRES) which can be interpreted as estimates of standard means for the period of 1920 to 1980. The AIRTMP_MN grid data layer is comprised of 1450x1380 derivative raster air temperature features derived based on 0.05 degrees resolution data originally from CRES / FAO. The layer provides nominal analytical/mapping at 1:220 000 000. Madagascar not included. Annual Total Air Temperature, Average Monthly Air Temperature (Annual) and the Monthly Air Temperature from January to December are also available for download. Acronyms and Abbreviations: CRES - Centre for Resource and Environmental Studies, The Australian National University (ANU); FAO - Food and Agriculture Organization of the United Nations.
-

Raster representing location score for intensive, closed, and semi-closed catfish farming systems using ponds, tanks, RAS, flow through and recirculation in Nigeria Produced under the scope of FAO’s Hand-in-Hand Initiative, Geographical Information Systems - Multicriteria Decision Analysis for value chain infrastructure location. Intensive aquaculture is characterized by high densities and artificial feed input. Closed or semi-closed techniques are less dependent on natural or physical geographical criteria. Require less water since it reuses/recirculates, can be placed indoors or in compounds, and are produced with artificial materials. The score is achieved by processing sub-model outputs characterizing natural geography, infrastructure, and demand factors: Considered criteria. a. Market accessibility - major urban areas. b. Water Balance - precipitation/evapotranspiration. c. Inputs - Crop and livestock d. Slope - terrain suitability. e. Farm-gate sales - based on population density classification. The location score consists of a simple arithmetic weighted sum of normalized/scaled grids, theoretically varying from 0 to 100: (“Accessibility MajorUrbanAreas” X 0.5) + ("WaterBalance" X 0.2) + (“CropsInput” X 0.1) + (“LivestockInput” X 0.10) + ("Slope " X 0.05) + (”FarmgateSales” X 0.05)