 FAO Map Catalog
Western Africa
Type of resources
Available actions
Topics
Keywords
Contact for the resource
Provided by
Years
Formats
Representation types
Update frequencies
status
-

The dataset contains the predicted areas of suitability for two tsetse fly species (palpalis and tachinoides). All of the distributions have been produced using variations of the same methodology - by modelling the "known" presence and absence of the flies (usually the 1977 Ford and Katondo maps modified with more recent information collected from national and international agencies and researchers). The modelling process relies on logistic regression of fly presence against a wide range of predictor variables for a large number of regularly spaced sample points for each area. The predictor variables include remotely sensed (satellite image) surrogates of climate - vegetation, temperature, moisture - which have been subjected to Fourier processing to provide an additional set of season and timing related measures for each parameter. Demographic, topographic and agroecological predictors are also used. These models are then applied to the predictor imagery to determine the predicted areas of suitability for tsetse. Data are provided at 1 kilometre resolution. The maps were produced in December 2002 for FAO/IAEA Joint Division by Environmental Research Group Oxford (ERGO Ltd) in collaboration with the Trypanosomosis and Land Use in Africa (TALA) research group.
-
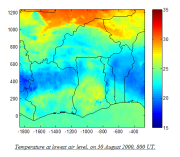
The whole set of simulated data contains over 400 Gb (hourly data for 10 years) after conversion to ASCII format. Warning: These "data" are not based on reanalysis of observations, but just on modeling with initial and boundary conditions from CMCC-CPS output. The high resolution modeling is an experiment. Especially the calculated precipitation may have systematic deviations from the observations. The purpose of these synthetic data is to test the merit or lack of merit of high-resolution modeling. The model grid is not aligned with latitude and longitude, so interpolation of the data may be necessary. The output is stored in separate files for each grid. Data content: 1.Temperature at 20 m (°C); 2. Specific humidity at 20 m (g/kg); 3. Wind speed at 20 m; 4. Wind direction at 20 m; 5. Short wave radiation (W/m2); 6. Sensible heat flux (W/m2); 7. Latent heat flux (W/m2, can be converted directly to evaporation in mm/h); 8. Cumulated precipitation (mm); Data storage: presently the data are stored in binary files. For each month there are 4 files: one file per ½ calender month - grid - combination. After conversion to text format, the size is about 2.5 Mb (outer grid) or almost 2 Mb (inner grid) for each simulated hour. The size of the whole set converted to ASCII is over 400 Gb. The simulated weather data or data-excerpts can be made available on demand only. Please contact Antoon Meesters at [email protected] to place your request. This data model has been produced in the framework of the "Climate change predictions in Sub-Saharan Africa: impacts and adaptations (ClimAfrica)" project, Work Package 2 (WP2). More information on ClimAfrica project is provided in the Supplemental Information section of this metadata.