 FAO Map Catalog
WP4
Type of resources
Available actions
Topics
Keywords
Contact for the resource
Provided by
Years
Formats
Representation types
Update frequencies
status
Resolution
-
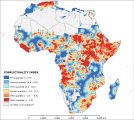
The “conflictuality index” describes the impact that conflicts have in a certain area in 2010. Area subjected to violence and conflict may have problem to receive assistance to develop adaptation measures and may lack the wiliness of the authority to implement such adaptation. The index results from the second cluster of the Principal Component Analysis preformed among 18 potential variables. The analysis identifies two dominant variables, namely “distance from conflict events” and “conflict events density”, assigning equal weights (0.5) to the two variables. Before to perform the analysis the variables were log transformed to shorten the extreme variation and then were score-standardized (converted to distribution with average of 0 and standard deviation of 1; inverse method was applied for “conflicts events density”) in order to be comparable. A shapefile of conflict events was gathered from the Uppsala Conflict Data Programme (UCDP). Considering that the effect of conflict aftermath may during years, we collect all the events position and number of victims from 1989 to 2010. The “distance from conflicts” was obtained via Euclidean distance calculation of the conflict events. The “conflict events density” is the result of a kernel density analysis on number of victims with a search radius of 200 Kilometer. This dataset has been produced in the framework of the “Climate change predictions in Sub-Saharan Africa: impacts and adaptations (ClimAfrica)” project, Work Package 4 (WP4). More information on ClimAfrica project is provided in the Supplemental Information section of this metadata.
-
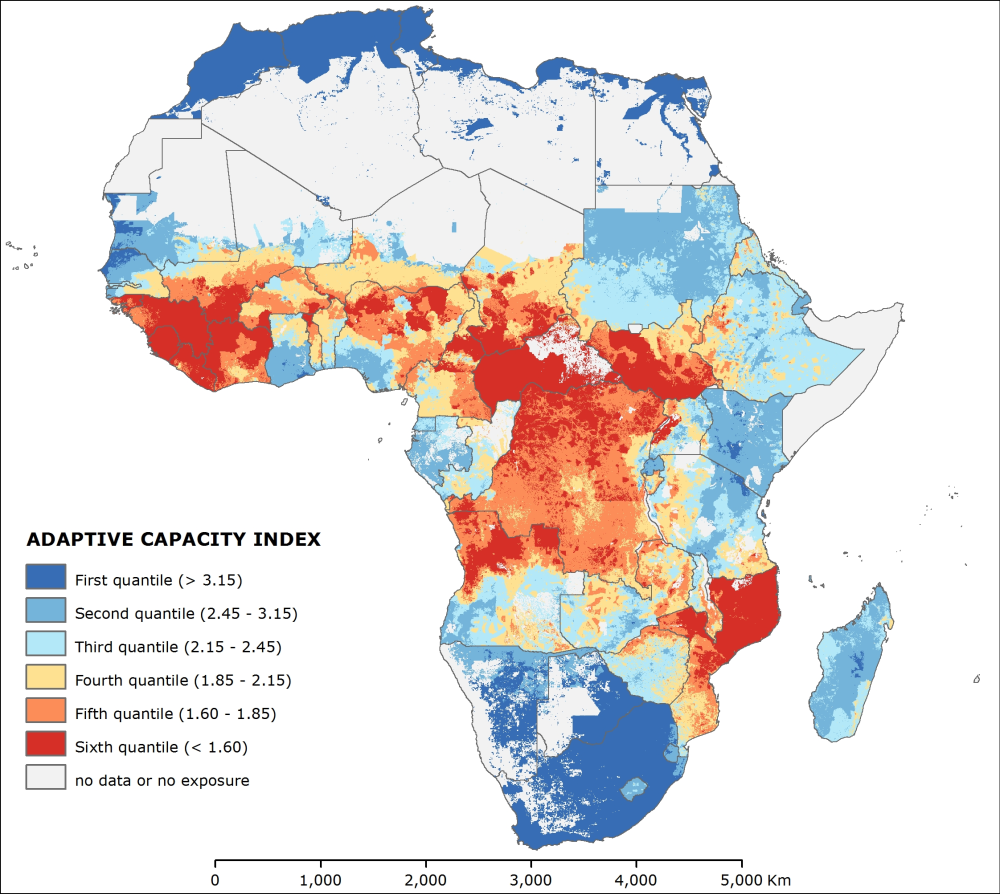
The “adaptive capacity index” symbolizes the adaptive potential to implement adaptation measures that help avert potential impacts in 2010. Adaptive capacity is a significant factor in characterizing vulnerability. The IPCC (2001) describes adaptive capacity as the potential or ability of a system, region, or community to adjust to the effects or impacts of climate change (including climate variability and extremes). Adaptive capacity is considered to be “a function of wealth, technology, education, information, infrastructure, skills, access to resources and stability and management capabilities”. The means of the adaptive capacity are the assets and entitlements that communities and individuals can mobilize in the face of environmental change. The more assets people have, the less vulnerable they are and vice versa. Here adaptive capacity is described as being dependent upon four assets: human capital, technological capital, financial capital and institutional capital. Therefore, the “adaptive capacity index” derived from the addition of four underlying indexes: the “human capital index”, the “technological capital index”, the “financial capital index” and the “institutional capital index”. Principal Component Analysis determines the weights of the four underlying indexes. The analysis run among the variables that compose such indexes and results in four weights: 0.58 for the “human capital index”, 0.16 for the “technological capital index”, 0.20 for the “financial capital index” and finally 0.06 for the “institutional capital index”. This dataset has been produced in the framework of the “Climate change predictions in Sub-Saharan Africa: impacts and adaptations (ClimAfrica)” project, Work Package 4 (WP4). More information on ClimAfrica project is provided in the Supplemental Information section of this metadata.
-
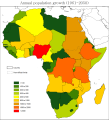
The annual population growth is derived by FAOSTAT dataset, from 1961 to present, and up to 2050 for the projected population. This dataset has been produced in the framework of the "Climate change predictions in Sub-Saharan Africa: impacts and adaptations (ClimAfrica)" project, Work Package 4, Deliverable 4.1 (WP4-D4.1). More information on ClimAfrica project is provided in the Supplemental Information section of this metadata.
-
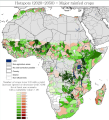
The hotspots zones of all the rainfed crops have been combined with the suitability classes as follow. The number of crops with a yield increase or decrease of more than 10 and 20% has been computed considering two suitability thresholds: one above 0% and another one above 40%. The results have been mapped showing the areas with positive impact in green and the areas with a negative impact in red. One map has been produced considering at least one scenario showing the same trend and the other one considering at least two scenarios showing the same trend. This data set has been produced in the framework of the “Climate change predictions in Sub-Saharan Africa: impacts and adaptations (ClimAfrica)” project, Work Package 4 (WP4). More information on ClimAfrica project is provided in the Supplemental Information section of this metadata.
-
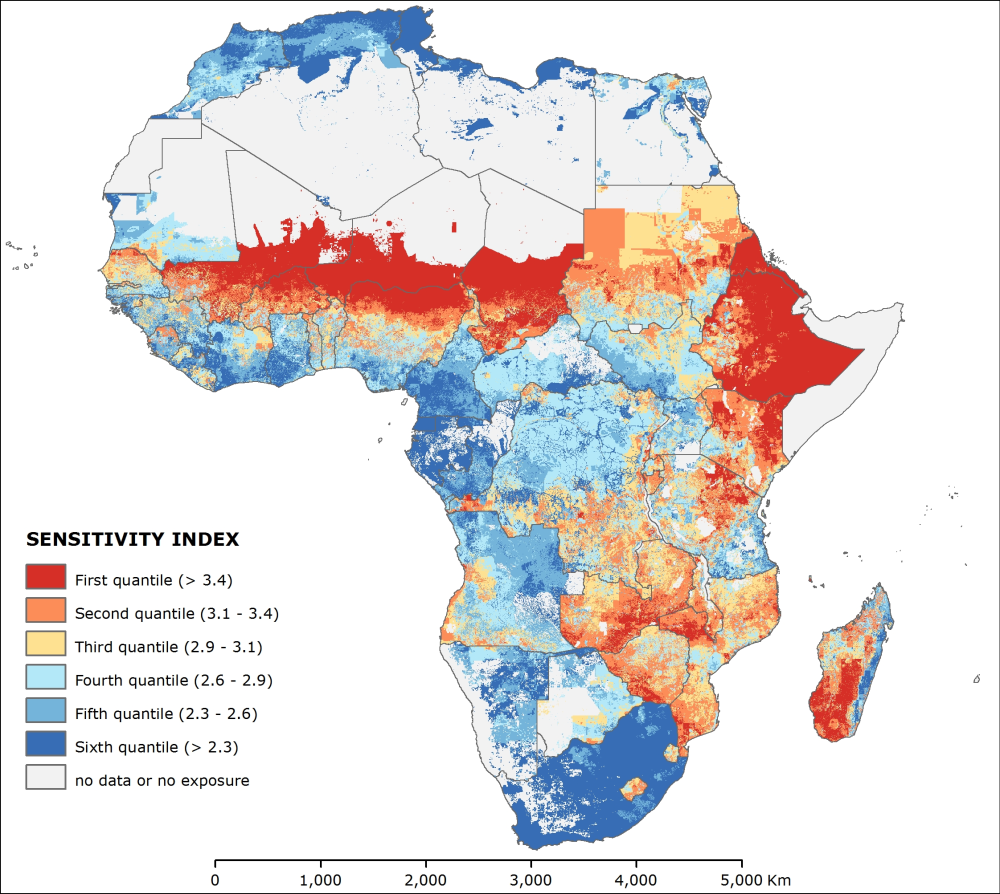
The “sensitivity index” describes the sensitivity or the human–environmental conditions that can worsen the hazard, ameliorate the hazard, or trigger an impact in 2010. Sensitivity in its general sense is defined as the degree to which a system is modified or affected by an internal or external disturbance or set of disturbances. This measure, which herein reflects the responsiveness of a system to climatic influences, is shaped by both socio-economic and ecological conditions and determines the degree to which a group will be affected by environmental stress. Therefore, the “sensitivity index” results from the addition of underlying indexes, namely the “human sensitivity index” and the “natural sensitivity index”, which relative weights are 0.55 and 0.44, respectively. The weights were computed via Principal Component Analysis among the primary variables that compose the two underlying indexes. This dataset has been produced in the framework of the “Climate change predictions in Sub-Saharan Africa: impacts and adaptations (ClimAfrica)” project, Work Package 4 (WP4). More information on ClimAfrica project is provided in the Supplemental Information section of this metadata.
-
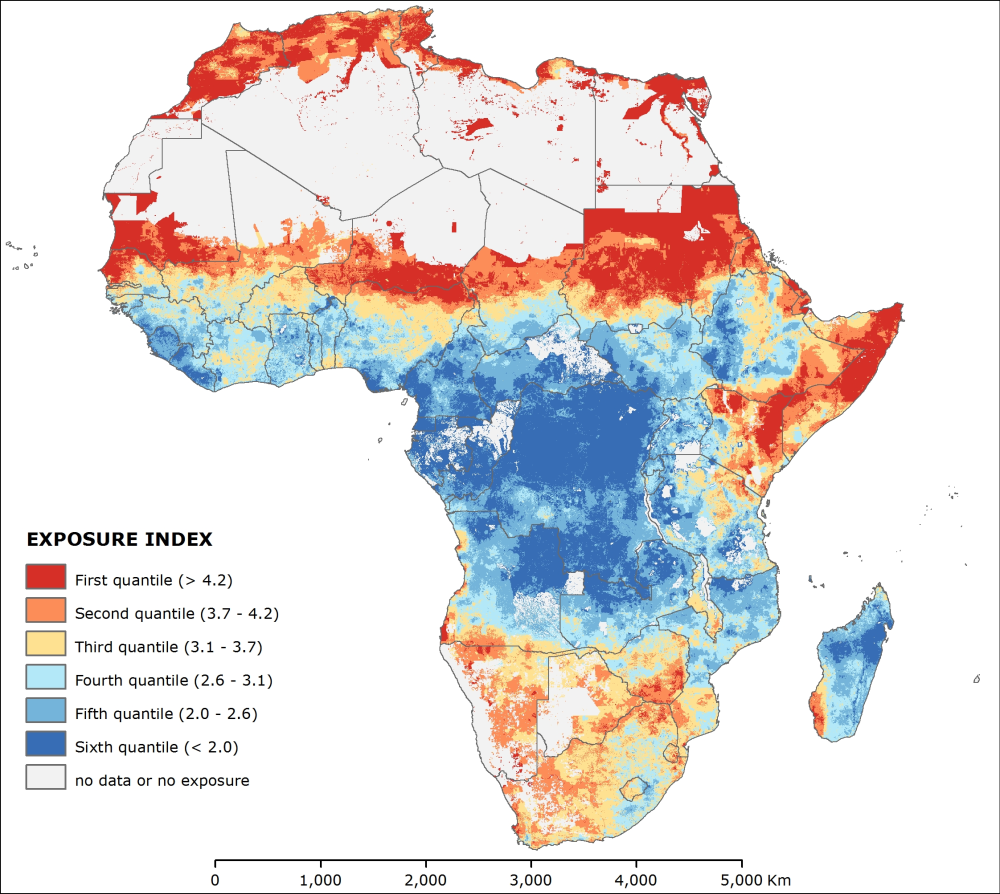
The “exposure index” relates to exposure that is the degree of climatic stress upon a particular unit of analysis or element at risk in 2010. The exposure is commonly defined like the combination between the density of element at risk and a hazard. Here the elements at risk are people, livestock units and crop land and the hazard is the climate change and its impacts. Thus the index results from the addition of two underlying indexes: the “element at risk index” and the “climatic stress index”. The relative weights of underlying indexes were 0.28 and 0.72 respectively for the “element at risk” and the “climatic stress indexes”. These weights were defined through Principal Component Analysis (retaining three components) among ten variables which compose the two underlying indexes. This dataset has been produced in the framework of the “Climate change predictions in Sub-Saharan Africa: impacts and adaptations (ClimAfrica)” project, Work Package 4 (WP4). More information on ClimAfrica project is provided in the Supplemental Information section of this metadata.
-
Hotspots zones have been identified for each agro-climatic and climatic parameter and future period, based on the yield anomaly classes (relative differences between the future and the historical period). For each crop and each period, the hotspots are represented by 5 classes: - Zones with a high decrease (>20%) for at least one scenario - Zones with a high decrease (>20%) for at least two scenarios - Zones with a high increase (>20%) for at least one scenario - Zones with a high increase (>20%) for at least two scenarios - Zones with a contradictory information between models This data set has been produced in the framework of the “Climate change predictions in Sub-Saharan Africa: impacts and adaptations (ClimAfrica)” project, Work Package 4 (WP4). More information on ClimAfrica project is provided in the Supplemental Information section of this metadata..
-

The “institutional capital index” relates to the management means that determine the potential adaptive capacity degree of a particular governance institution in 2010. It is linked with the governance capacity and behavior, the tendency to conflict and the ability to manage environmental issue of a certain governmental institution. It is the combination of three underlying indexes: the “governance index”, “conflictuality index” and the “environmental management index”. These original indexes correspond to the three principal components identified by Principal Component Analysis among 18 potential variables. The analysis assigned the relative weights of 0.6 , 0.3 and 0.1 for the “governance index”, “conflictuality index” and the “environmental management index”, respectively. This dataset has been produced in the framework of the “Climate change predictions in Sub-Saharan Africa: impacts and adaptations (ClimAfrica)” project, Work Package 4 (WP4). More information on ClimAfrica project is provided in the Supplemental Information section of this metadata.
-

The “human capital index” describes the social and wellbeing means that determine the potential adaptive capacity degree of a particular unit of analysis in 2010. It is linked with the health and educational conditions of the analysed communities. It is the combination of three underlying indexes: the “public health index”, the “motherhood and childhood health index” and the “education index”. These three original indexes correspond to the three principal components recognized by Principal Component Analysis among 16 potential variables. The analysis assigned relative weights to the prime indexes: 0.45 for the “public health index” and 0.275 for both the other two indexes. This dataset has been produced in the framework of the “Climate change predictions in Sub-Saharan Africa: impacts and adaptations (ClimAfrica)” project, Work Package 4 (WP4). More information on ClimAfrica project is provided in the Supplemental Information section of this metadata.
-
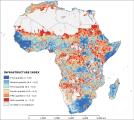
The “infrastructure index” describes the degree of development of physical facilities and networks in a certain area in 2010. The quality of infrastructure is an important measure of the relative adaptive capacity of a region. Regions with developed infrastructure systems are presumed to be better able to adapt to climatic stresses. Improved infrastructure may reduce transactions costs, and strengthen the links between labor and product markets. Moreover, improved infrastructure should encourage the formation of non-farm enterprises as a source of diversification in the short run and, eventually, a transition out of agriculture. The index results from the second cluster of the Principal Component Analysis preformed among 10 potential variables. The analysis identifies three dominant variables, namely “road density”, “road availability” and “infrastructure poverty”, assigning weights of 0.47, 0.36 and 0.17, respectively. Before to perform the analysis all variables were log transformed to shorten the extreme variation and then were score-standardized (converted to distribution with average of 0 and standard deviation of 1) in order to be comparable. A shapefile of road network was published by the Center for International Earth Science Information Network of Columbia University in 2013. The “road density” was computed by calculating the Kilometers of road per cell (size 0.5 arc-minute) and then running a focal statistic (radius of about 30 km to spread the effect of a transportation network in a neighborhood). The “road availability” is the road density divided by the logarithm of population. The 0.5 arc-minute grid “infrastructure poverty” is based on the average lights per pixel in 2010, which was produced by NOAA National Geophysical Data Center, divided by the logarithm of population. The original data was highly fragmented and at fine resolution may have contained fine-scale artifacts at urban edges due to data mismatch between the population and night-lights datasets. Thus focal statistics ran within 20 Km to calculate an average values and represents some of the extend influence of the infrastructure network for local people. The density and availability of road is a normally accepted indicator of infrastructure development degree. Moreover, developed road network facilitate the diffusion of rural products to large markets enhancing the income of rural population and sharing the risk of crisis among larger area. The average night light density per capita represents the diffusion of electricity among population and here is considered a proxy of diffusion of developed infrastructural network. This dataset has been produced in the framework of the “Climate change predictions in Sub-Saharan Africa: impacts and adaptations (ClimAfrica)” project, Work Package 4 (WP4). More information on ClimAfrica project is provided in the Supplemental Information section of this metadata.