 FAO Map Catalog
Tag_forestry
Type of resources
Available actions
Topics
Keywords
Contact for the resource
Provided by
Years
Formats
Representation types
Update frequencies
status
Scale
Resolution
-

The Congo forest cover change map 2000-2012 was created by the national forest services of Congo (CNIAFF) in collaboration with UN-REDD programme. It builds on 3 existing products that are combined to comply with the national forest definition (30% tree cover, 0.5 ha MMU). It is stratified into 3 forest types (Primary, Secondary, Primary/Swamp)
-

Land cover of Bangladesh for the year 2015 based on SPOT 6m multispectral image segmentation and interpretation. Land cover classes are defined using Land Cover Classification System (LCCS) and are based on the National Land Representation system (NLRS).
-
Land suitability analysis map provides information about land suitability for different landscape restoration activities. In Cox’s Bazar, socio-economic and biophysical information about wood fuel demand and supply were used to assess gaps and needs in support to safe access to fuel and energy as well as to sustainable land degradation. Source: Bangladesh Forestry Department, FAO, IOM
-
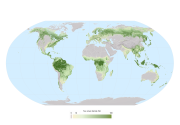
The 2015 Global Forest Resources Assessment (FRA2015) continues the tradition of seeking to describe the worldâs forests â a tradition that began in 1948. The worldâs forest 2010 map is a raster product with a pixel size of 250 meters by 250 meters. It was prepared with the following geospatial layers : - Forest cover data from the Vegetation Continuous Fields product (VCF) derived from the Moderate Resolution Imaging Spectroradiometer (MODIS) sensor, on-board the Terra and Aqua satellites (Earth Observation System, NASA) with a 250 m spatial resolution (Hansen et al., 2003). - Water data from the Shuttle Radar Topography Mission (SRTM, NASA) Water Body Data at 250 m spatial resolution in combination with the MODIS global water mask (Carroll et al., 2009). - Elevation data from the SRTM at 1 km resolution, down-sampled to the 10 million scale. - Country boundaries and coastlines from the Global Administrative Unit Layer (GAUL, 2008) of the FAO. - Global ecological zones (FAO, 2012) References: - Hansen, M., R. DeFries, J.R. Townshend, M. Carroll, C. Dimiceli, and R. Sohlberg, 2003. Vegetation Continuous Fields MOD44B, 2001 Percent Tree Cover, Collection 3, University of Maryland, College Park, Maryland, 2001. - Carroll, M., Townshend, J., DiMiceli, C., Noojipady, P., Sohlberg, R. 2009. A New Global Raster Water Mask at 250 Meter Resolution. International Journal of Digital Earth. ( volume 2 number 4) - FAO, 2012 Global ecological zones for FAO forest reporting: 2010 Update. Forest resources Assessment Working Paper 179, Rome, 2012.
-
The Global Climate Risk Index 2020 analyses to what extent countries and regions have been affected by impacts of weather-related loss events (storms, floods, heat waves etc.). The most recent data available - for 2018 - were taken into account in this map. Source: The Climate Risk Index is based on data from Munich RE. Germanwatch
-

This dataset displays the countries that have made used of the Open Foris tools for the national forest monitoring. Open Foris is a free open-source software launched by FAO for environmental monitoring. It consists of a set of tools which facilitate flexible and efficient data collection, analysis and reporting and developed in collaboration with countries. These tools can be used for a wide range of monitoring purposes such as forest inventories, climate change reporting, socio-economic surveys, biodiversity assessment, land use and forestry measurement and deforestation monitoring with remote sensing. Bangladesh, among other countries, took advantage from the use of the Open Foris platform for the creation of critical information on forest and land, enhancing the country’s efforts to mitigate and adapt to climate change and contributing to investment plans.
-
In 2015, the Bangladesh Forest Department, with technical support from FAO, and financial support from USAID, launched the project “strengthening National Forest Inventory and Satellite Land Monitoring in Support of REDD+ in Bangladesh”. Through this project, a robust and modern national forest monitoring system was developed, using the latest FAO tools such as Open Foris and LCCS to collect about 2000 permanent field inventory plots and over 6000 household surveys all over the country, integrating biophysical and socio-economic data and information.
-
The forest cover map is the first comprehensive worldwide view of forests, using a consistent methodology and standard data. The map has a resolution of 1 km and is based on 1992-93 and 1995-96 AVHRR data. Four broad land cover categories are presented following FAO standard classification: closed forest, open/fragmented forest, other wooded land and other land. Due to the coarse source data, the map cannot be used to obtain reliable country forest cover statistics. The final map has been drafted through validation with information/maps based on higher resolution data, e.g. Landsat TM or SPOT images. An accuracy assessment will be carried out in year 2000 to determine the classification accuracy.
-
In 2015, the Bangladesh Forest Department, with technical support from FAO, and financial support from USAID, launched the project “strengthening National Forest Inventory and Satellite Land Monitoring in Support of REDD+ in Bangladesh”. Through this project, a robust and modern national forest monitoring system was developed, using the latest FAO tools such as Open Foris and LCCS to collect about 2000 permanent field inventory plots and over 6000 household surveys all over the country, integrating biophysical and socio-economic data and information.
-
The dataset represents population density calculated based on FAOSTAT data 2017.